


Bollinger Band Crossover Forex Trading Strategy
There are a couple of ways to trade Bollinger Bands. You could trade with the trend using the middle line, or you could use it as a trend reversal strategy.
One of the advantages of the Bollinger Bands is that it could also be used to indicate overbought or oversold prices using the outer bands. Whenever candles are constantly touching the upper band, the market is said to be on a bullish trend. But whenever candles are continuously touching the lower band, the market is said to be on a bearish trend. However, this would also mean that price is also either overbought or oversold. Even though a market could trend for extended periods, markets usually reverse after some time. What comes up must come down. This will be the main idea behind this strategy.
With this strategy, we will be using the outer bands as an indication that price may reverse. However, there are also many instances wherein although price did bounce off a bit from an outer band, price continued going the direction of the initial trend, after a minor bounce.
To avoid fake reversals, we will need a confirmation as part of the strategy. To do this, we will be needing the Bollinger Band’s middle line. The middle line is the average of the outer bands. As such, the middle line tends to have the same characteristics as moving averages. One of its characteristics which is similar to moving averages is that it acts as a dynamic support and resistance. However, just like all supports and resistances, once a support or resistance is broken, price often breaks-out creating a strong thrust. The same is true with the Bollinger Band’s middle line. Whenever price breaks through it, price often continues going to the opposite outer band. In a sense, one could say that the market might be changing directions.
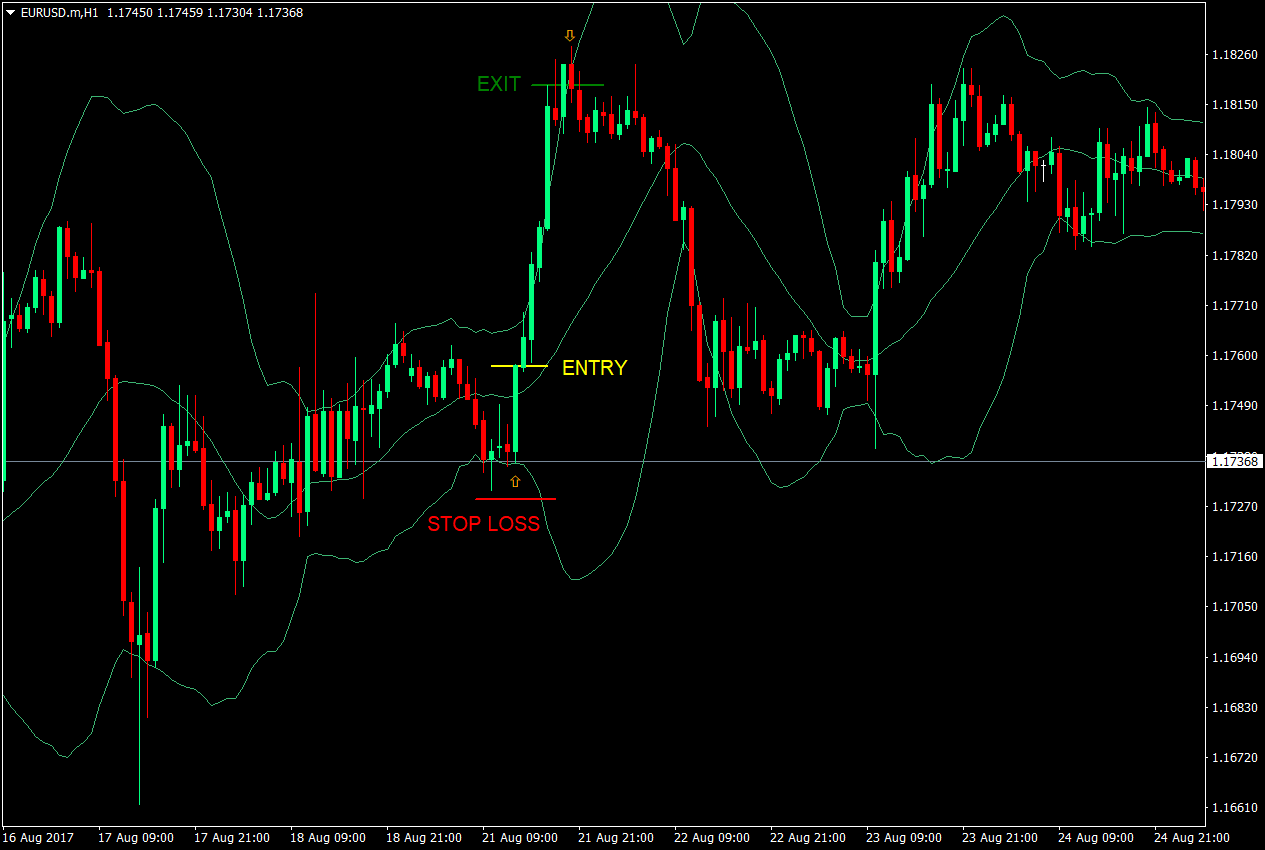
The Buy Setup – Entry, Stop Loss & Exit
Buy Entry Rules:
- Price should initially be touching the lower outer band, indicating that the market is oversold.
- Price should head towards the middle line indicating a possible reversal.
- The candle that crosses the middle line should strongly close above the middle line.
- As soon as the candle closes strongly above the middle line, a buy entry could be initiated.
Stop Loss: The stop loss should be a few pips below the most recent swing low created by the oversold market.
Exit: After rallying above the outer band, as soon as a candle closes back below the upper band, the trade should be closed.
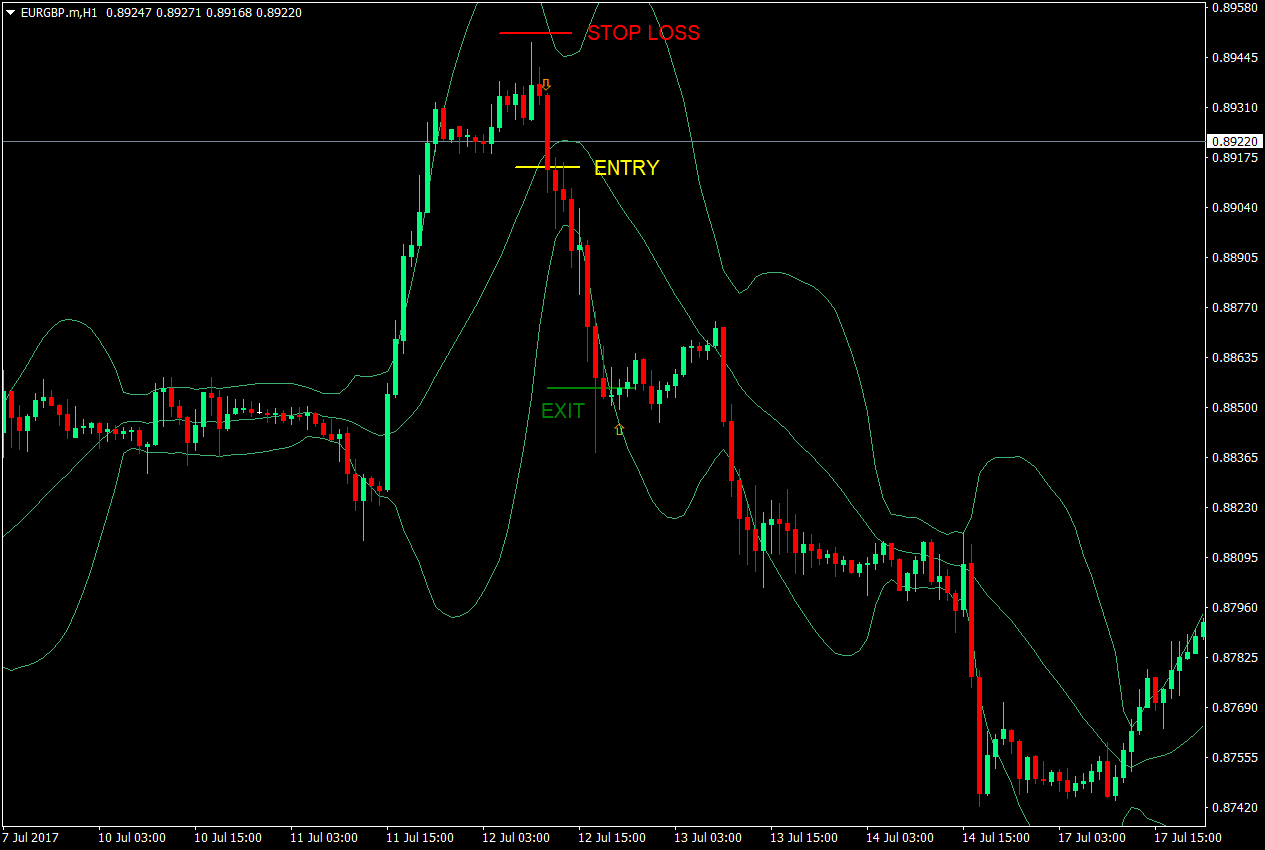
The Sell Setup – Entry, Stop Loss & Exit
Sell Entry Rules:
- Price should initially be hovering near the upper band indicating that the market is overbought.
- Price should reverse towards the middle line indicating a possible reversal.
- The candle that crosses the middle line should strongly close below it.
- As soon as a strong bearish candle closes below the middle line, a sell setup could be initiated.
Stop Loss: The stop loss should be a few pips above most recent swing high created by the overbought market.
Exit: The target area should be the oversold Bollinger Band territory. After closing below the lower band for a few candles, as soon as a candle closes above the lower band, the trade should be closed.
Conclusion
A trader should be able to trade both trend continuation and trend reversal setups. By using the Bollinger Bands, traders could learn to react to the market depending on how the market behaves on critical areas around the Bollinger Band. This particular strategy is excellent for reversal setups, as well as setups that come from a contraction phase, before it expands for a rally.
The advantage of using this strategy for trend reversals is that it has both the overbought and oversold component of the Bollinger Band, as well as a confirmation of the change in market conditions as price crosses over the middle line. This increases the reliability of the trade.
The good thing about this strategy is that it could be used in a Bollinger Band based trading system, wherein the trader could do trend continuations and reversals using the same indicator.