


Band-Wagon Momentum Day Trade Forex Trading Strategy
The Bollinger Band is a very versatile indicator. It is like a swiss knife indicator for trading. It is one of those indicators which gives you so much information with just one look, information which can be interpreted and used in different ways.
The common ways of looking at Bollinger Bands would to use it as a trend indicator. If price is above the middle line, then trend bias is bullish, if below then bearish. Another would be to use it to identify overbought and oversold market conditions. If price is above the upper band, then the market is said to be overbought, if it is below, then oversold. Another use for it would be as an indication of momentum. If the bands get a rapid expansion and widening, then the market is said to be entering a volatile phase.
One use that is often overlooked is its use as a momentum indicator. This is because it is quite a contrarian view of how the Bollinger Bands is normally used. The outer bands are usually used to indicate overbought and oversold market scenarios. However, the same bands could also be used to indicate momentum. When you come to think of it, when the bands expand indicating volatility, the candles formed are usually long and strong candles closing outside of the bands. The type of candles that are typically described as momentum candles. Also, momentum candles which occur during the initial stage of an expansion phase, usually occur right after a tight contraction phase. Not only does this indicate volatility and momentum, it also indicates directionality in a very simple manner. Whichever band the candle closes beyond of is the direction of the momentum.
This concept of using the Bollinger Bands as a momentum indicator will be the background for this strategy.
The Setup: Band-Wagon Momentum
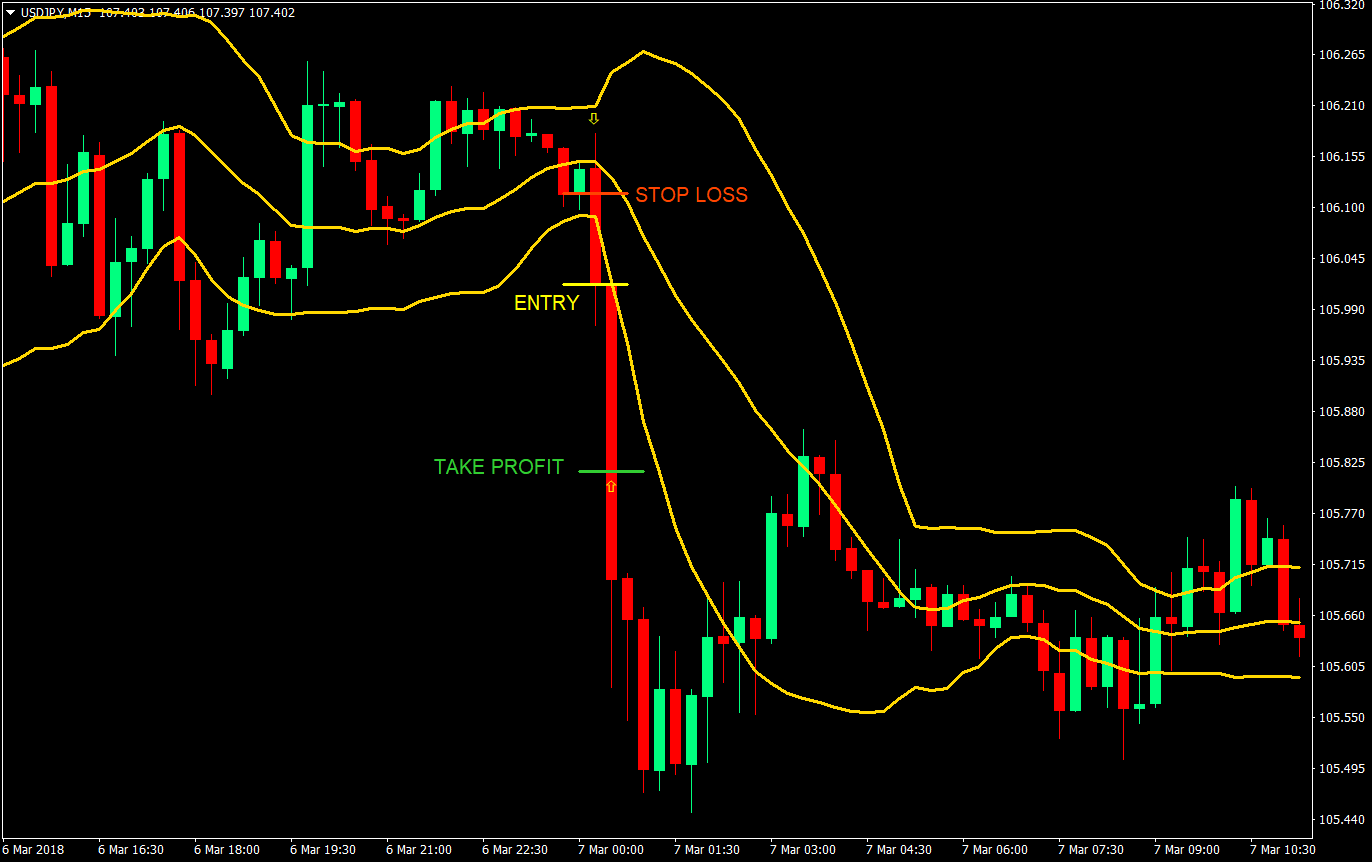
With this strategy, we will be having a very simple setup, using only a single Bollinger Band. This will be a 20 period Bollinger Band with a standard deviation of 1.
Since this is a day trading strategy, we will be using the 15-minute chart. It is important that we stick to this timeframe because we will be having a fixed stop loss and take profit in pips. This timeframe is also very ideal for day trading. For day trading standard, this is right smack in the middle, when it comes to speed.
What we will be looking for is for price to be relatively contained within the band. Sure, there will be a few pierces outside of the band a few candles prior to the momentum breakout, but it doesn’t stay out for long and should close within the band. This would indicate contraction.
Then, what we would be waiting for is for a candle to close beyond an outer band with a strong momentum. This means, the candle should have a big, long body, with little to no wicks on the direction of the breakout. This momentum breakout serves as our entry signal.
Since this is a momentum strategy, we will be capping our risk and profits, but with a positive reward-risk ratio. This is because momentum candles are notorious for making traders buy at the peak or sell at the bottom. These candles also reverse pretty quick. We don’t want to give back our profits and end up at a loss, coming from a potentially winning trade.
Buy Entry:
- Price should be somewhat contained within the band for a few candles
- A momentum candle (long candle with little to no wick) should close above the upper Bollinger Band
- Enter a buy market order at the close of the momentum candle
Stop Loss: Set the stop loss at -10 pips from the entry
Take Profit: Set the take profit at +20 pips from the entry
Sell Entry
- Price should be somewhat contained within the band for a few candles
- A momentum candle (long candle with little to no wick) should close below the lower Bollinger Band
- Enter a sell market order at the close of the momentum candle
Stop Loss: Set the stop loss at +10 pips from the entry
Take Profit: Set the take profit at -20 pips from the entry
Conclusion
Now, this strategy is a typical momentum breakout strategy, basing solely on the momentum candle. No trend direction is taken into account, no pattern, no price action. The only thing that is considered is the breakout from a few candles of contraction.
Since there are just a few filters with this strategy, there will be some false entries. If you would notice, on our sell trade sample chart, there was a bullish momentum candle that does fit our parameters, yet would have resulted at a loss. However, the 2:1 reward-risk ratio should cover for the losses on this strategy.
One thing you could tweak here is the timeframe. The common day trading charts are usually the 5-minute, 15-minute, 30-minute and 1-hour chart. If you find the 15-minute chart to be a bit slow, you could move to the 5-minute chart. However, you would also have to adjust the stop loss and take profit targets. The lower the timeframe, the lower the targets. If you would want to move up to the 1-hour chart, then you should have a wider stop loss and a wider take profit target.
Recommended MT4 Broker
- Free $50 To Start Trading Instantly! (Withdrawable Profit)
- Deposit Bonus up to $5,000
- Unlimited Loyalty Program
- Award Winning Forex Broker
- Additional Exclusive Bonuses Throughout The Year

>> Claim Your $50 Bonus Here <<
Click here below to download: