


The forex market is a gold mine of opportunities. Different market conditions and scenarios provide different opportunities for traders to make money out of the market.
One of the most lucrative scenarios for traders are when the market starts to gain momentum and start a rally, or on the flip side starts to drop steeply. This usually occurs whenever there is pent-up volume waiting for a trade. As soon as the market volume start to rush in, price candles start to move strongly in one direction. Momentum builds up. Then, before you know it, the market has started to trend. Momentum trading is very appealing to many because it usually is the start of a strong market trend. Traders who are able to take the trade entry at the start of the trend are in for a good ride and have the opportunity to make huge yields in one trade.
3D Tunnel Breakout Forex Trading Strategy is a strategy that capitalizes on such momentum breakouts. It uses a pair of high probability technical indicators that allow traders to identify if the market is gaining momentum or not. Traders who could capitalize on such momentum breakout could earn huge yields on such trades.
3D Oscillator
The 3D Oscillator indicator is a custom technical indicator which helps traders identify momentum and short-term trend reversals. It is based on a combination of underlying parameters such as the Relative Strength Index (RSI) and the Stochastic Oscillator.
This indicator is an oscillator which plots two lines much like the Stochastic Oscillator. However, instead of limiting the line much like the classic Stochastic Oscillator, the lines in this indicator could move in a free range. The lines could be positive or negative. Positive lines are indicative of a bullish trend, while negative lines are indicative of a bearish trend. As such, lines that are crossing above zero could indicate a bullish trend signal, while lines that are crossing below zero could indicate a bearish trend signal.
The crossing over of the lines with each other are also indicative of a possible trend reversal. If the faster line is crossing above the slower line, then it could be taken as a bullish signal. On the other hand, if the faster line is crossing below the slower line, then it could be used as a bearish signal. The indicator also plots dots below the lines to indicate a bullish crossover, or below the lines to indicate a bearish crossover.
Arrows and Curves
The Arrows and Curves indicator a technical indicator that helps traders identify momentum breakouts.
This indicator is based on a channel indicator which marks the threshold where price could be gaining momentum. If price is breaking above the channel, this could be considered as a bullish momentum breakout. On the other hand, if price is breaking below the channel, the market could be gaining a bearish momentum.
The indicator also plots arrows signaling the breakout points. These arrows could be used as an entry signal in a momentum breakout type of strategy.
Trading Strategy
This strategy uses the confluence of the 3D Oscillator and the Arrows and Curves indicator to produce momentum breakout entry setups.
On the 3D Oscillator, the signal will simply be based on the crossing over of the lines from negative to positive or vice versa, depending on the direction of the breakout trade. Ideally, both lines should be crossing over. However, there are instances wherein the momentum breakout occurs in one candle, which makes the slower line lagging. In this case, it is fine to take the signal of the faster line as long as the slope of the lines are steep.
On the Arrows and Curves indicator, price should break out of the channel. This would be followed by an arrow being plotted by the indicator pointing the direction of the breakout.
Trades are taken based on the confluence of these signals. However, price action and candlesticks should also be observed. A strong momentum candle adjacent to the entry candle would be a very good additional confirmation of the momentum breakout.
Indicators:
- ArrowsAndCurves (default setting)
- 3D Oscillator
- D1RSIPer: 50
- D2StochPer: 32
Preferred Time Frames: 1-hour and 4-hour charts
Currency Pairs: majors, minors and FX crosses
Trading Sessions: Tokyo, London and New York sessions
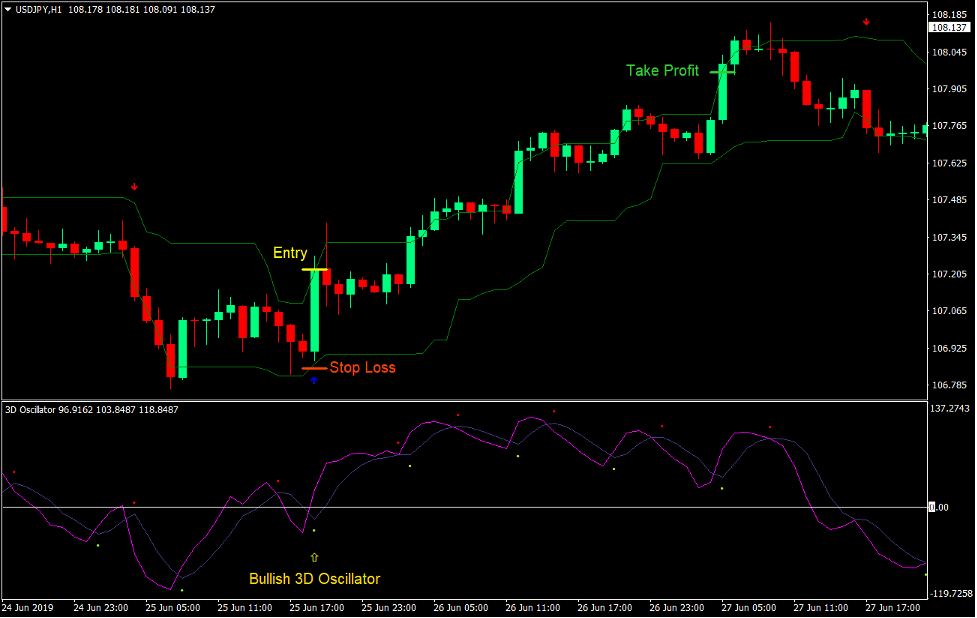
Buy Trade Setup
Entry
- Price should break above the Arrows and Curves channel.
- The Arrows and Curves indicator should plot an arrow pointing up.
- The 3D Oscillator indicator lines should be crossing above zero.
- Enter a buy order on the confluence of these conditions.
Stop Loss
- Set the stop loss below the lower line of the channel.
Exit
- Set the take profit target at 2x the risk on the stop loss.
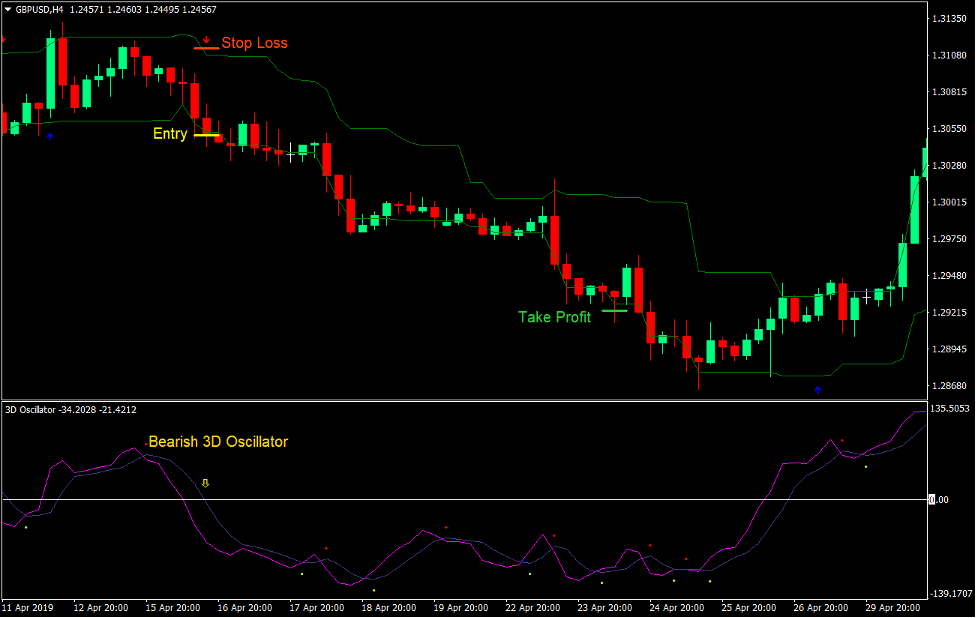
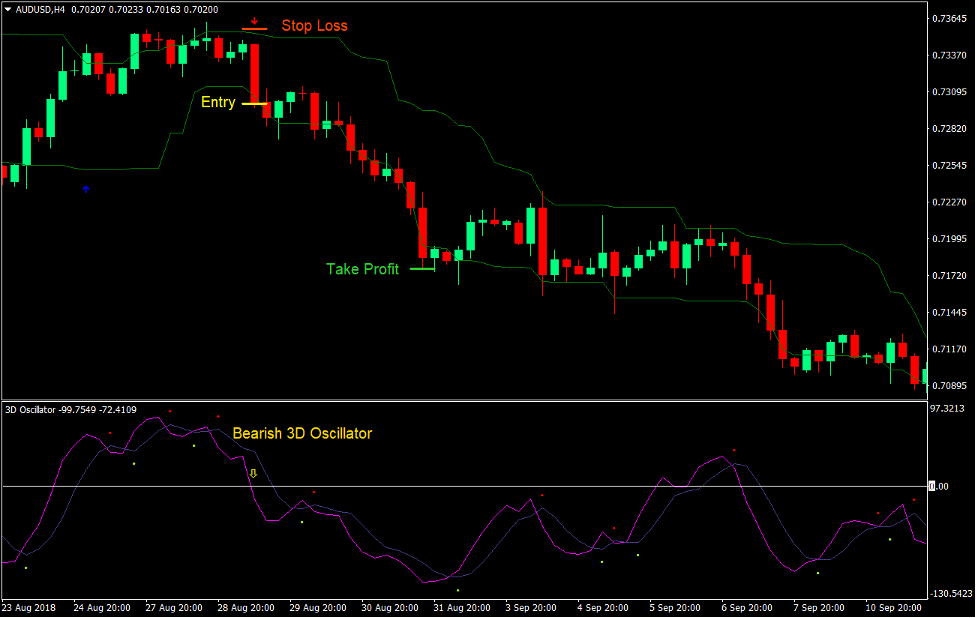
Sell Trade Setup
Entry
- Price should break below the Arrows and Curves channel.
- The Arrows and Curves indicator should plot an arrow pointing down.
- The 3D Oscillator indicator lines should be crossing below zero.
- Enter a sell order on the confluence of these conditions.
Stop Loss
- Set the stop loss above the upper line of the channel.
Exit
- Set the take profit target at 2x the risk on the stop loss.
Conclusion
This trading strategy is a simple momentum breakout strategy using a channel indicator.
Breakouts from bands and channels are working momentum breakout strategies. As long as you are able to find the right setup, it would be easy for a trader to identify such momentum breakouts. This strategy uses an indicator that works well for such trade setup. Price tends to move in the direction of the breakout more often than not. Add to it the confirmation of the 3D Oscillator indicator and you have trade setups that have a higher probability.
Recommended MT4 Brokers
XM Broker
- Free $50 To Start Trading Instantly! (Withdraw-able Profit)
- Deposit Bonus up to $5,000
- Unlimited Loyalty Program
- Award Winning Forex Broker
- Additional Exclusive Bonuses Throughout The Year

>> Sign Up for XM Broker Account here <<
FBS Broker
- Trade 100 Bonus: Free $100 to kickstart your trading journey!
- 100% Deposit Bonus: Double your deposit up to $10,000 and trade with enhanced capital.
- Leverage up to 1:3000: Maximizing potential profits with one of the highest leverage options available.
- ‘Best Customer Service Broker Asia’ Award: Recognized excellence in customer support and service.
- Seasonal Promotions: Enjoy a variety of exclusive bonuses and promotional offers all year round.

>> Sign Up for FBS Broker Account here <<
Click here below to download: