


많은 수익성있는 거래자가 사용하는 전략 유형 중 하나는 시장 흐름 유형의 거래 전략입니다. 이러한 유형의 전략은 가격 조치를 활용하여 가격이 반전될 수 있는 가능한 영역을 식별합니다. 특히, 시장 흐름 거래자들은 종종 가격 움직임의 스윙 고점과 스윙 저점을 사용하여 지원 및 저항 영역을 식별합니다. 시장 반전 가능성을 관찰할 수 있는 곳이 바로 이 영역입니다. 이 거래 전략은 매우 효과적일 수 있지만 특히 새로운 거래자에게 가능한 시장 반전을 객관적으로 식별하는 것은 종종 매우 어렵습니다. 이 전략은 트레이더가 식별된 지지 또는 저항 영역에서 형성되는 모멘텀 반전을 식별하고 확인하는 데 사용할 수 있는 객관적인 방법을 제공합니다.
가격 행동 스윙 로우 및 스윙 하이 지원 및 저항
지원 및 저항 수준을 식별하는 것은 트레이더가 배워야 할 가장 기본적인 기술 중 하나입니다. 이는 트레이더가 시장이 반전될 수 있는 가격 영역을 식별하고 가장 최적의 가격 포인트에서 거래를 시작할 수 있도록 하기 때문입니다.
지지 영역은 가격이 하향 모멘텀에서 상향 모멘텀으로 반전될 수 있는 가격대입니다. 반면 저항 영역은 시장이 상승 모멘텀에서 하락 모멘텀으로 전환될 수 있는 가격대입니다.
지원 및 저항 영역을 식별하는 방법에는 여러 가지가 있습니다. 일부는 여러 스윙 고점과 스윙 저점을 연결하여 지지선과 저항선으로 간주되는 선을 형성합니다. 다른 사람들은 지표를 사용하여 지지 및 저항의 동적 영역을 사용합니다.
지지 및 저항 영역을 객관적으로 식별하는 가장 효과적인 방법 중 하나는 스윙 고점과 스윙 저점을 식별한 다음 스윙 고점 또는 스윙 저점 근처의 영역을 지지 또는 저항 영역으로 사용하는 것입니다. 이것은 종종 지지 또는 저항 수준을 식별하기 위해 수평선으로 표시되거나 지지 또는 저항 영역을 나타내기 위해 직사각형으로 표시됩니다.
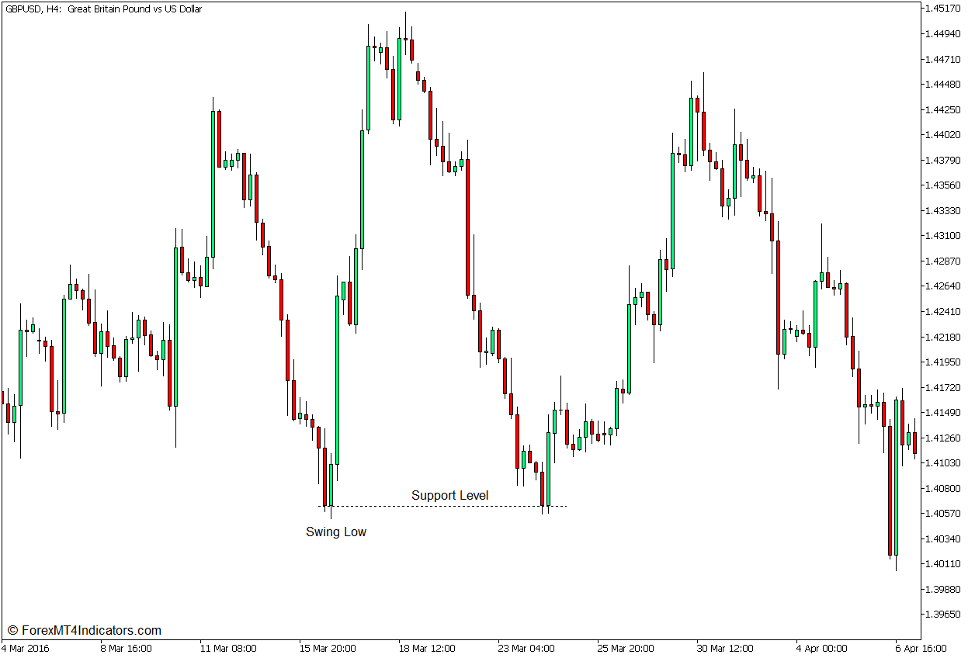
트레이더는 스윙 저점을 식별하여 수평 지지 영역을 식별할 수 있습니다. 그런 다음 낮은 스윙의 심지를 사용하여 트레이더는 지지선을 그릴 수 있습니다.
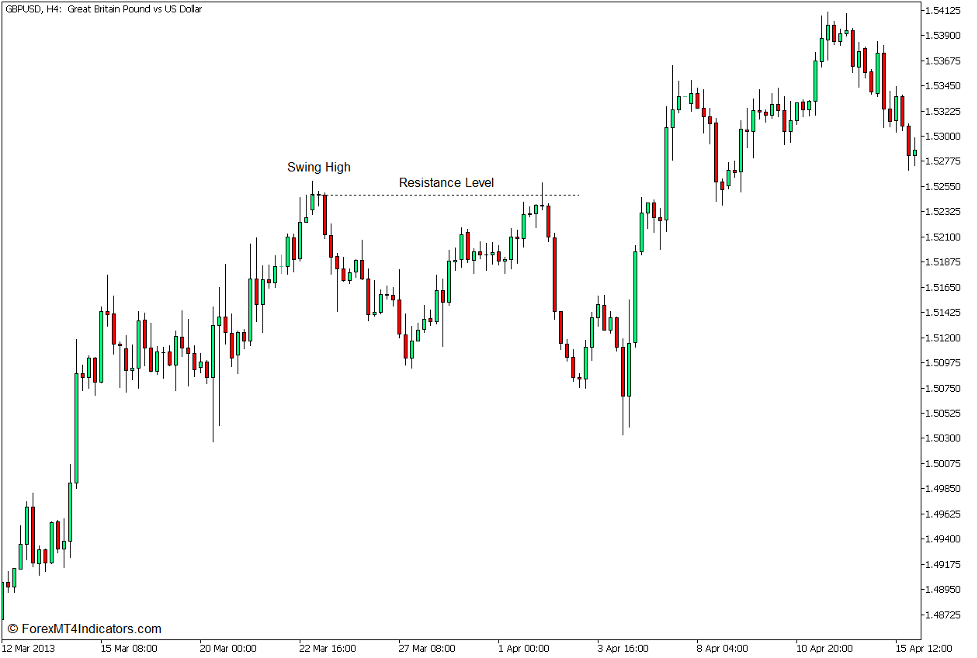
스윙 최고점을 식별하여 수평 지원 영역을 식별할 수도 있습니다. 그런 다음 스윙 하이의 상단 심지를 사용하여 트레이더는 저항 수준을 나타내는 수평선을 그릴 수 있습니다.
스윙 라인 표시기
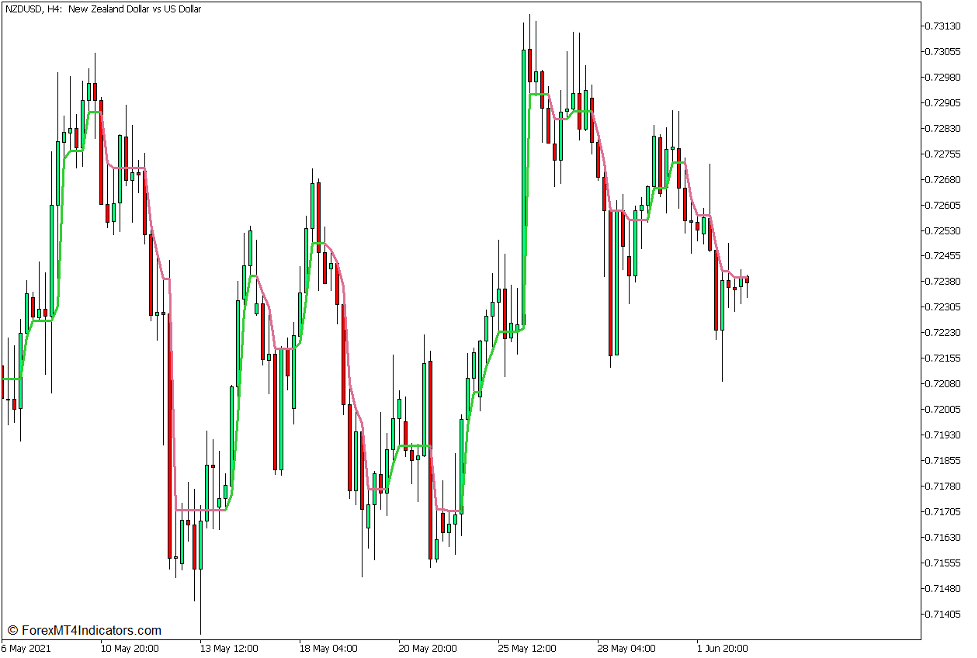
스윙 라인 지표는 가격의 평균 움직임을 기반으로 하는 모멘텀 지표입니다. 이 정보는 각 가격 막대의 고가와 저가의 최근 과거 가격 포인트에서 추정됩니다.
이 지표는 가격 움직임을 매우 밀접하게 따르는 선을 그립니다. 가격 차트를 따라 가격 움직임을 따라갈 때 각 가격 막대와 일관되게 교차합니다.
Swing Line Indicator의 고유한 기능 중 하나는 단기 추세의 방향을 나타내기 위해 플롯하는 선의 색상이 변경된다는 것입니다. 강세 모멘텀을 감지할 때마다 라임 그린 라인을 그립니다. 반면에 약세 모멘텀을 감지할 때마다 옅은 보라색 빨간색 선을 그립니다. 트레이더는 단순히 선의 색상 변화를 사용하여 가능한 모멘텀 반전을 식별할 수 있습니다.
거래 전략 개념
수평 지지 및 저항 영역은 추세 반전 가능성을 관찰할 수 있는 훌륭한 가격대입니다. 그러나 가격이 수평 지지 또는 저항 영역에 도달할 때마다 반전되어야 하는 것은 아닙니다. 시장은 트레이더가 반전 신호에 따라 조치를 취하기 전에 먼저 모멘텀 반전 가능성의 징후를 보여야 합니다.
단기 모멘텀에 따라 작동하는 추세 추종 지표인 스윙 라인 지표는 트레이더가 가능한 모멘텀 반전을 식별하고 확인하는 데 사용할 수 있는 훌륭한 도구입니다. 가격 조치에 매우 민감하여 트레이더가 시장 반전 신호에 객관적으로 대응할 수 있습니다.
사용자는 먼저 스윙 하이 또는 스윙 로우를 기준으로 지지 또는 저항 영역을 식별해야 합니다. 그런 다음 가격이 식별된 영역에 도달하면 트레이더는 스윙 라인 표시기를 사용하여 추세 반전을 확인하고 모멘텀이 사라질 때까지 추세를 따라갈 수 있습니다.
거래 설정 구매
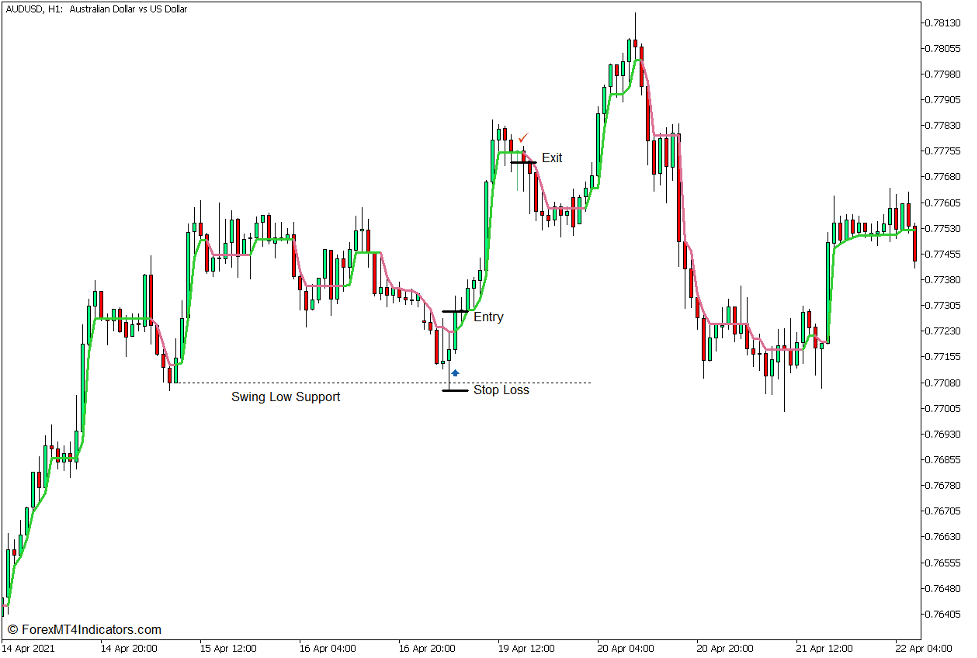
기입
- 가격 움직임에 따라 유효한 스윙 로우를 식별합니다.
- 저점 스윙의 저점으로 식별되는 캔들의 하단 심지 영역을 기준으로 수평선을 그립니다. 이것은 지원 라인이 될 것입니다.
- 가격이 지지선 영역을 다시 방문할 때까지 기다리십시오.
- 스윙 라인 표시기가 연두색으로 바뀌는 즉시 구매 주문을 시작하십시오.
손실을 중지
- 지지선에 닿는 가격 행동의 저점 아래에 손절매를 설정하십시오.
출구
- 스윙 라인이 옅은 보라색 빨간색으로 되돌아가는 즉시 거래를 마감하십시오.
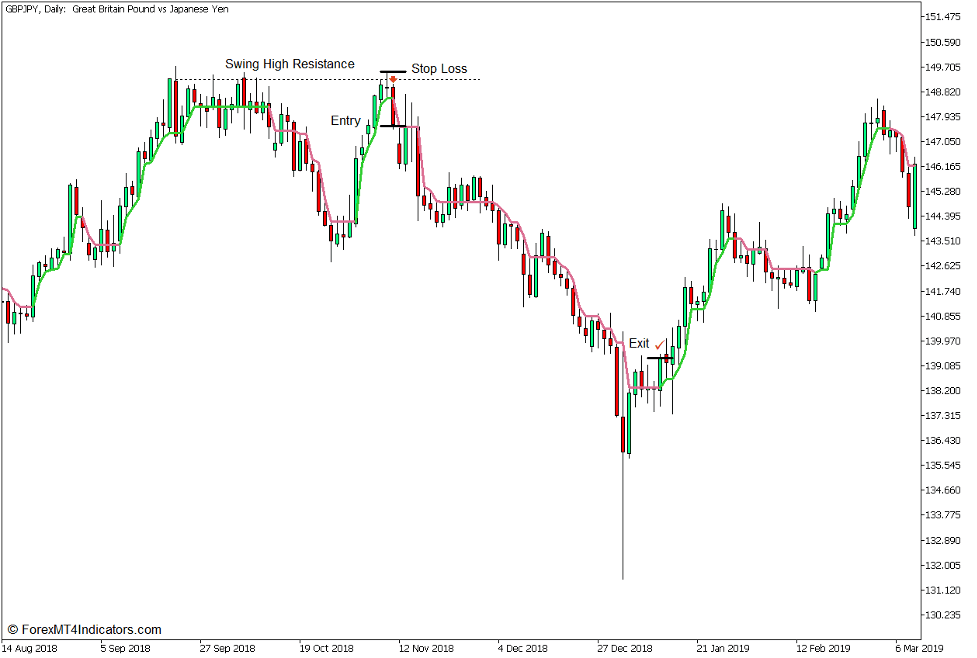
판매 거래 설정
기입
- 가격 움직임에 따라 유효한 스윙 고점을 식별합니다.
- 스윙 고점의 정점으로 식별되는 캔들의 위쪽 심지 영역을 기준으로 수평선을 그립니다. 이것은 저항선이 될 것입니다.
- 가격이 저항선 영역을 다시 방문할 때까지 기다리십시오.
- 스윙 라인 표시기가 옅은 보라색 빨간색으로 바뀌는 즉시 매도 주문을 엽니다.
손실을 중지
- 저항선에 닿는 가격 행동의 고점 위에 손절매를 설정하십시오.
출구
- 스윙 라인이 라임 그린으로 되돌아가는 즉시 거래를 마감하십시오.
결론
이 거래 전략은 매우 효과적인 거래 전략이 될 수 있습니다. 높은 확률의 거래 진입을 식별하는 데 중요한 두 가지 구성 요소, 즉 가능한 지원 또는 저항 영역과 객관적인 모멘텀 반전에 기반한 진입 신호를 활용하기 때문입니다.
이 전략은 효과적인 거래 신호가 될 수 있지만 여전히 독립형 거래 설정으로 사용해서는 안됩니다. 거래자가 더 나은 결과를 위해 확립된 시장 흐름 유형의 거래 전략과 함께 이러한 신호를 사용하는 것이 가장 좋습니다.
이 전략을 사용할 때 트레이더는 가격 움직임을 올바르게 관찰하고 시장 흐름을 읽는 방법도 배워야 합니다. 이를 통해 올바른 지원 및 저항 영역을 식별할 수 있으므로 수익성 있는 거래의 가능성이 크게 높아집니다. 이러한 기본 사항을 배울 수 있는 거래자는 이러한 신호를 시장 흐름 유형의 전략과 통합하면서 수익을 올릴 수 있습니다.
추천 MT5 브로커
XM 브로커
- 무료 $ 50 즉시 거래를 시작하려면! (인출가능이익)
- 입금 보너스 최대 $5,000
- 무제한 로열티 프로그램
- 수상 경력에 빛나는 외환 브로커
- 추가 독점 보너스 일년 내내

FBS 브로커
- 거래 100 보너스: 거래 여정을 시작하려면 $100를 무료로 받으세요!
- 100% 입금 보너스: 예치금을 최대 $10,000까지 두 배로 늘리고, 강화된 자본으로 거래하세요.
- 최대 1 활용 : 3000: 이용 가능한 가장 높은 레버리지 옵션 중 하나로 잠재적 이익을 극대화합니다.
- '아시아 최고의 고객 서비스 브로커' 상: 고객 지원 및 서비스의 우수성을 인정받았습니다.
- 계절별 프로모션: 1년 내내 다양한 독점 보너스와 프로모션 혜택을 누려보세요.

다운로드하려면 여기를 클릭하십시오.