


모멘텀 반전은 훌륭한 거래 기회입니다. 그러나 이는 시장 모멘텀의 현재 흐름에 역행하는 것을 의미하기 때문에 시장 반전을 예상하기 어려운 경우가 많습니다. 트레이더가 시장 반전 가능성을 예상하는 한 가지 방법은 다이버전스를 찾는 것입니다.
아래에서 논의할 거래 전략은 OsMA 지표와 Zigzag Int 지표를 사용하여 다이버전스를 식별하는 단순화된 방법을 보여줍니다.
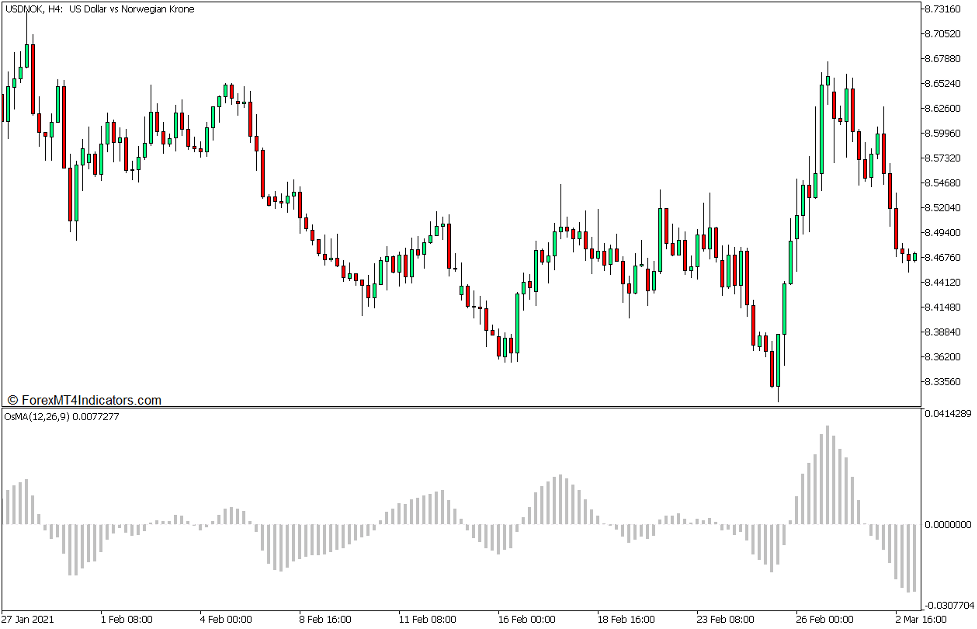
오실레이터 표시기의 이동 평균
오실레이터 표시기의 이동 평균 또는 이동 평균 오실레이터(OsMA)는 기본 오실레이터에서 파생되는 모멘텀 표시기입니다. 이름에서 알 수 있듯이 기본 오실레이터 표시기의 이동 평균(MA)을 계산합니다.
OsMA 내에서 사용되는 가장 일반적인 오실레이터는 MACD(이동 평균 수렴 및 발산)입니다. 그러나 OsMA의 다른 버전은 다양한 시장에서 작동할 수 있는 OsMA 지표를 제시하기 위해 프로그램 내에서 다양한 유형의 오실레이터를 사용했습니다.
OsMA 지표의 개념은 매우 간단합니다. 기본적으로 기본 오실레이터의 이동 평균을 계산하도록 프로그래밍되어 있습니다. 그런 다음 오실레이터에서 이동 평균 값을 뺍니다. 결과 차이는 OsMA의 히스토그램 막대 또는 오실레이터 라인을 그리는 데 사용됩니다.
이 전략에 사용된 OsMA 지표는 MACD를 기반으로 합니다. 두 개의 지수 이동 평균(EMA)을 계산하며 그 차이는 기본 MACD의 값으로 사용됩니다. 그런 다음 MACD에서 파생된 값의 단순 이동 평균(SMA)을 추가로 계산합니다. 마지막으로 OsMA 지표는 MACD 값과 SMA 값의 차이를 계산합니다. 결과 값은 OsMA 표시기의 히스토그램 막대를 그리는 데 사용됩니다.
이 OsMA 지표는 히스토그램 막대를 표시하여 시장의 진동을 나타냅니다. 이 막대는 XNUMX 근처에서 진동합니다. 양수 막대는 시장이 강세 편향에 있음을 나타내고 음수 막대는 시장이 약세 편향에 있음을 나타냅니다.
모멘텀 스윙은 OsMA 값의 상승 또는 하락을 기반으로 예상할 수도 있습니다. 긍정적이든 부정적이든 일련의 상승하는 OsMA 값은 시장이 강세 모멘텀을 얻고 있음을 나타냅니다. 반대로 OsMA 값이 떨어지면 약세 모멘텀 스윙이 가능함을 나타냅니다.
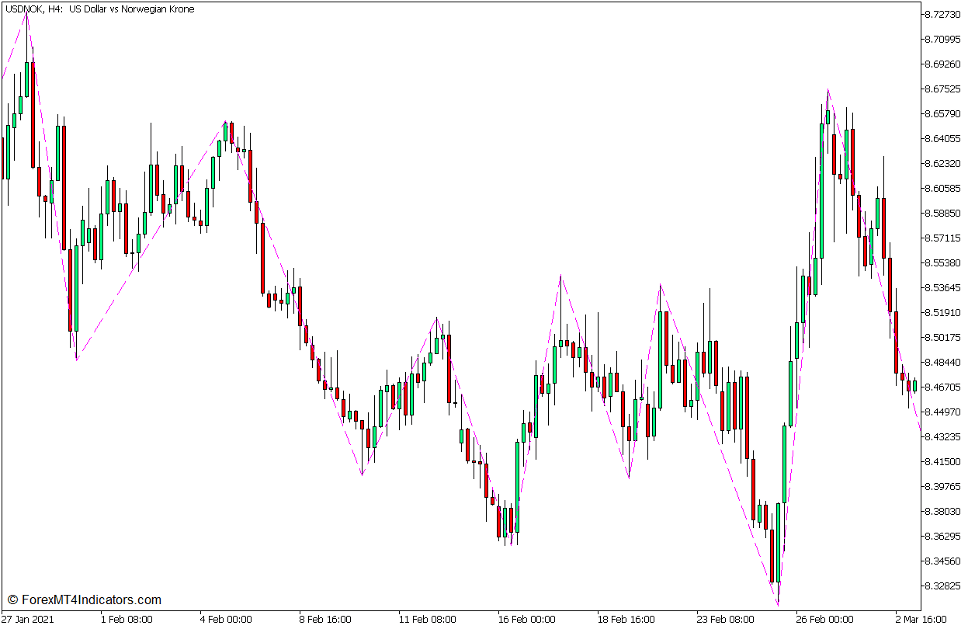
지그재그 Int 표시기
Zigzag Int Indicator는 Zigzag Indicator의 버전인 맞춤형 기술 지표입니다. 하나의 스윙 포인트를 다른 스윙 포인트로 연결하는 선을 플로팅하여 트레이더가 스윙 최고점과 스윙 최저점을 식별할 수 있도록 돕기 위해 개발된 지표입니다.
이 지표는 이전 모멘텀 방향에서 가격 움직임의 편차를 계산하여 스윙 고점과 스윙 저점을 식별하는 알고리즘을 사용합니다. 위반할 때마다 새로운 모멘텀 스윙 방향을 감지하도록 지표를 트리거하는 편차 임계값이 있습니다. 이 편차 임계값은 일반적으로 5%로 사전 설정됩니다. 가격 움직임이 이 임계값 위의 현재 모멘텀 방향과 반대 방향으로 움직이면 지표는 새로운 모멘텀 방향을 감지하고 새로운 스윙 포인트를 감지하려고 시도합니다. 새 스윙 포인트를 감지하는 즉시 이전 스윙 포인트와 새 스윙 포인트를 연결하는 선을 그립니다. 지표는 높은 스윙이 감지될 때마다 위로 이동하는 선을 그리고 스윙이 낮을 때마다 아래로 이동하는 동일한 프로세스를 지속적으로 반복하여 지그재그 패턴을 만들어 지그재그 표시기라고 합니다.
지그재그 표시기의 이 버전은 스윙 최고점과 스윙 최저점을 연결하는 파란색 파선을 그립니다. 트레이더는 식별된 스윙 포인트를 사용하여 가격 행동, 지원 및 저항 수준, 주문 블록의 궤적을 쉽게 이해할 수 있습니다.
거래 전략 개념
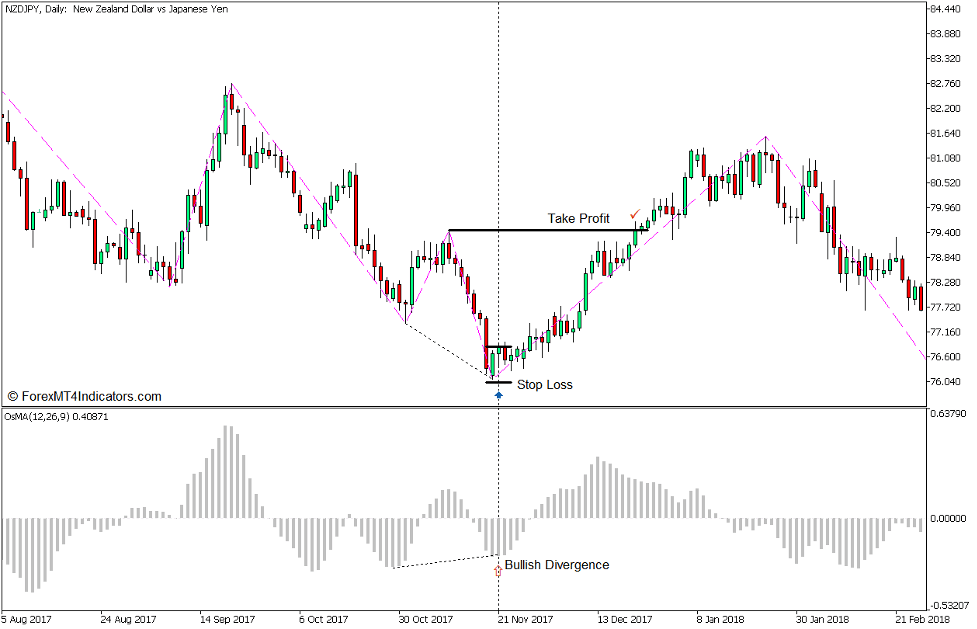
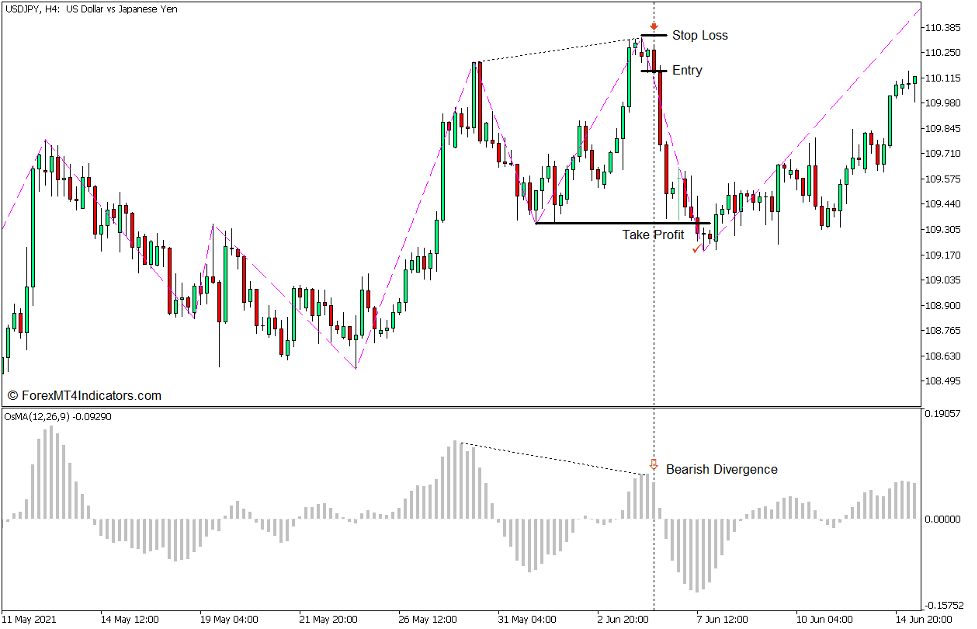
OsMA 및 Zigzag INT Divergence Forex Trading Strategy for MT5는 Zigzag Int Indicator 및 OsMA Indicator를 사용하여 분기를 거래하는 반전 거래 전략입니다.
Zigzag Int Indicator는 트레이더가 유효한 스윙 고점과 스윙 저점을 쉽게 식별할 수 있도록 도와줍니다. 확인된 스윙 최고점과 최저점은 OsMA 차트의 해당 피크 및 딥과 비교됩니다. 거기에서 우리는 가격 행동이 OsMA 막대와 비교할 때 발산을 형성하는지 관찰할 수 있습니다.
유효한 다이버전스가 있는 경우 수준을 거부하고 반전을 시작하는 경우 캔들의 특성을 관찰할 수 있습니다. 이는 캔들스틱 패턴, 캔들 색상 변화, 모멘텀 약화를 통해 확인할 수 있습니다. 역전은 OsMA 막대의 궤적을 값 증가에서 감소로 또는 그 반대로 변경하여 확인됩니다.
거래 설정 구매
기입
- Zigzag Int 표시기로 표시된 대로 유효한 스윙 로우를 식별합니다.
- 스윙 저점과 OsMA 막대의 딥을 비교하고 유효한 강세 다이버전스가 있는지 확인합니다.
- 강세 반전 가능성을 나타내는 경우 가격 움직임을 관찰하십시오.
- OsMA 막대 값이 증가하기 시작하자마자 구매 주문을 엽니다.
손실을 중지
- 진입 캔들 아래 프랙탈에 손절매를 설정합니다.
출구
- 가장 최근의 스윙 최고점에서 이익 실현 목표를 설정하십시오.
판매 거래 설정
기입
- Zigzag Int Indicator가 나타내는 유효한 스윙 최고점을 식별합니다.
- 스윙 최고점을 OsMA 막대의 최고점과 비교하고 유효한 약세 다이버전스가 있는지 확인합니다.
- 약세 반전 가능성을 나타내는 경우 가격 움직임을 관찰하십시오.
- OsMA 막대 값이 감소하기 시작하자마자 매도 주문을 엽니다.
손실을 중지
- 진입 캔들 위의 프랙탈에 손절매를 설정합니다.
출구
- 가장 최근의 스윙 로우에서 테이크 프로핏 목표를 설정하십시오.
결론
다이버전스는 가능한 반전의 매우 효과적인 지표가 될 수 있습니다. 실제로 다이버전스를 시장 반전 가능성을 고려하기 위한 주요 근거로 사용하는 전문 트레이더가 많이 있습니다.
그러나 다이버전스를 기반으로 한 거래는 트레이더가 스윙 고점과 스윙 저점을 식별하는 데 능숙해야 합니다. 이 거래 전략은 Zigzag Int Indicator를 사용하여 스윙 최고점과 스윙 최저점을 객관적으로 식별하는 방법에 대한 단순화된 방법을 보여주기 때문에 잠재적인 다이버전스를 식별하기 위한 기초로 스윙 포인트를 사용할 수 있습니다.
추천 MT5 브로커
XM 브로커
- 무료 $ 50 즉시 거래를 시작하려면! (인출가능이익)
- 입금 보너스 최대 $5,000
- 무제한 로열티 프로그램
- 수상 경력에 빛나는 외환 브로커
- 추가 독점 보너스 일년 내내

FBS 브로커
- 거래 100 보너스: 거래 여정을 시작하려면 $100를 무료로 받으세요!
- 100% 입금 보너스: 예치금을 최대 $10,000까지 두 배로 늘리고, 강화된 자본으로 거래하세요.
- 최대 1 활용 : 3000: 이용 가능한 가장 높은 레버리지 옵션 중 하나로 잠재적 이익을 극대화합니다.
- '아시아 최고의 고객 서비스 브로커' 상: 고객 지원 및 서비스의 우수성을 인정받았습니다.
- 계절별 프로모션: 1년 내내 다양한 독점 보너스와 프로모션 혜택을 누려보세요.

다운로드하려면 여기를 클릭하십시오.