


외환 시장에서 거래할 때마다 거래자의 마음을 움직이는 두 가지 심리적 요인이 있습니다. 하나는 탐욕이고 다른 하나는 두려움입니다. 대부분의 거래자들은 거래할 때 돈을 잃게 된 것에 대해 탐욕을 비난하지만 두려움은 거래자의 계좌에 피해를 주기도 합니다.
노련한 거래자들은 시장에서 거래할 때 승패가 주어진다는 것을 알고 있습니다. 종종 거래자들은 탐욕으로 인해 돈을 잃고, 이로 인해 종종 게임 계획에서 벗어나게 됩니다. 그러나 규율 있는 거래자들은 탐욕 때문이 아니라 순전히 시장이 시장이고 원하는 것은 무엇이든 하기 때문에 돈을 잃습니다. 그것은 모두 자신의 전략 통계의 일부입니다. 그러나 때때로 거래자들은 잠재적으로 이익을 얻을 수 있는 거래를 두려워하기 때문에 통계의 일부인 손실에서 회복할 수 없습니다. 이게 다 두려움 때문입니다.
트레이더가 종종 놓치는 분명한 기회 중 하나는 시장이 추세를 보일 때입니다. 많은 거래자들은 시장 추세를 보고 침을 흘리며 추세가 시작될 때 거래를 할 수 있기를 바랍니다. 그러나 추세가 곧 끝날 수 있다는 두려움 때문에 위험을 감수하지 않으려고 합니다.
추세 시장에는 많은 잠재력이 있습니다. 트레이더는 가격을 쫓지 않고 추세 시장에 진입하는 방법만 알면 됩니다.
일목 균형표 긴코 효
Ichimoku Kinko Hyo는 그 자체로 완전한 거래 시스템이라고 주장할 수 있는 몇 안 되는 기술 지표 중 하나입니다. 이것은 이 지표가 트레이더에게 장기 추세에서 단기 추세 및 즉각적인 가격 조치에 이르기까지 시장이 무엇을 하고 있는지에 대한 조감도를 제공하기 때문에 가능합니다.
Ichimoku Kinko Hyo는 여러 개의 수정된 이동 평균선으로 구성되며 대부분 특정 기간 내의 가격 중앙값을 기반으로 합니다.
Tenkan-sen 또는 전환선은 지난 XNUMX개 기간 내 가격의 중앙값으로 계산됩니다. 이 선은 단기 추세를 나타냅니다. 이 라인은 일반적으로 Kijun-sen 라인과 함께 단기 추세 반전을 확인하는 데 사용됩니다.
기준선 또는 기준선은 지난 26개 기간 동안의 가격 중앙값을 기반으로 합니다. 이 선은 단기에서 중기 추세를 나타냅니다. 이 라인은 추세 반전 가능성에 대한 조기 경고일 수 있으므로 트레일링 스톱 로스 포인트로 사용할 수 있습니다.
센코 스팬 A 또는 선행 스팬 A는 26개 기간 전방에 표시된 Tenkan-sen 및 Kijun-sen의 중앙값에서 파생됩니다.
Senkou Span B 또는 Leading Span B는 앞으로 52개 기간을 표시한 지난 26개 기간 동안의 가격 중앙값입니다.
Senkou Span A와 B는 Kumo 또는 구름을 형성합니다. Kumo는 장기 추세의 방향을 나타냅니다. Senkou Span A가 Senkou Span B보다 높으면 장기 추세는 강세입니다. 반면에 Senkou Span A가 Senkou Span B보다 낮으면 장기 추세는 약세입니다.
치커우 스팬 또는 후행 스팬은 26개 기간 전에 표시된 현재 기간 종가입니다. 이 선은 가격 행동의 특성을 결정하는 데 사용할 수 있습니다. 또한 스윙 포인트를 기반으로 잠재적 지원 또는 저항 수준을 식별하는 데 사용할 수 있습니다.
FBS 피셔
FBS Fisher는 가우시안 정규 분포의 개념을 기반으로 하는 오실레이터 유형의 기술 지표입니다. 이 표시기는 가격 행동의 역사적 움직임에서 계산을 도출하고 수치를 가우시안 정규 분포로 변환합니다. 이는 오실레이터 범위 내에서 가격 움직임을 정상화하여 트레이더가 역전될 수 있는 잠재적인 과매도 또는 과매수 시장을 식별하는 데 도움이 됩니다.
결과 수치는 양수 또는 음수일 수 있는 히스토그램 막대로 표시됩니다. 이 표시기는 또한 막대의 색상을 수정하여 모멘텀이 잠재적으로 강화되거나 약화됨을 나타냅니다.
양의 금색 막대는 강세 추세를 나타내고 음의 금색 막대는 약세 추세의 강화를 나타냅니다. 양수 빨간색 막대는 약세 추세를 나타내고 음수 라임 막대는 약세 추세 약화를 나타냅니다.
무역 전략
Ichimoku Fisher 외환 거래 전략은 장기 추세 추종 전략 또는 추세 재진입 전략으로 사용할 수 있습니다.
Kumo는 Senkou Span A와 B가 겹치는 방식과 Kumo 내부 영역의 음영 색상을 기반으로 장기 추세의 방향을 식별하는 데 사용됩니다.
풀백은 Tenkan-sen과 Kijun-sen이 일시적으로 반전되게 합니다. 또한 FBS Fisher 막대가 일시적으로 역전되도록 해야 합니다.
Tenkan-sen이 추세 방향을 향해 기준선을 교차하고 FBS Fisher가 중간선을 교차하여 추세의 방향을 나타내는 금색 막대를 표시하면 시장은 추세 방향을 계속하고 있는 것으로 간주됩니다. 이것은 유효한 거래 설정을 구성합니다.
지표 :
- 일목 균형표 긴코 효
- FBS 피셔
선호하는 시간 프레임 : 1 시간 및 4 시간 차트
통화 페어 : FX 메이저, 마이너 및 크로스
거래 세션 : 도쿄, 런던, 뉴욕 세션
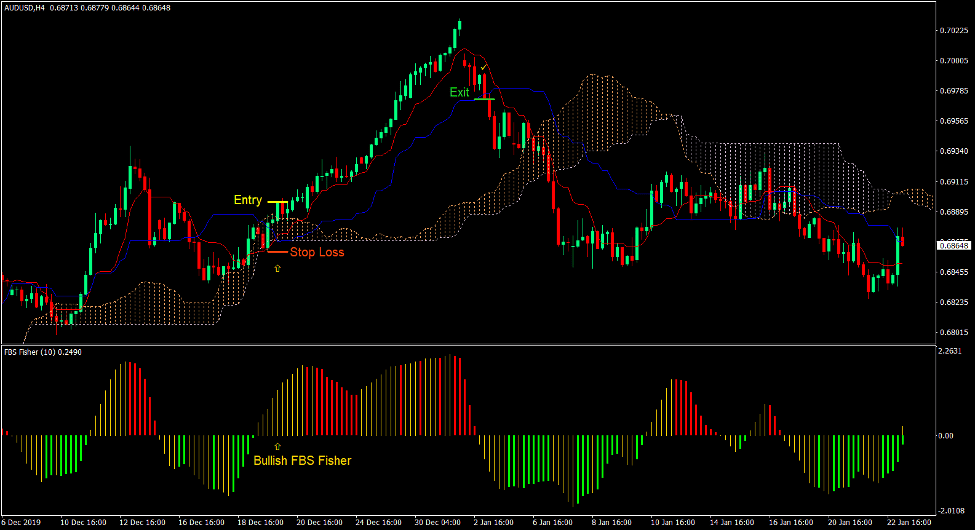
거래 설정 구매
기입
- Senkou Span A는 Senkou Span B보다 위에 있어야 하며 Kumo는 모래 갈색이어야 합니다.
- 가격 조치는 추세를 따라야 합니다.
- 가격은 Kumo 쪽으로 후퇴하여 Tenkan-sen이 일시적으로 Kijun-sen 아래로 교차하고 FBS Fisher 막대가 음수가 되도록 합니다.
- FBS 피셔가 양의 금괴를 계획하고 텐칸센이 기준센 위로 교차하는 즉시 매수 주문을 입력하십시오.
손실을 중지
- 진입 캔들 아래 지지대에 손절매를 설정하십시오.
출구
- 가격이 기준선 아래에서 마감되는 즉시 거래를 마감하십시오.

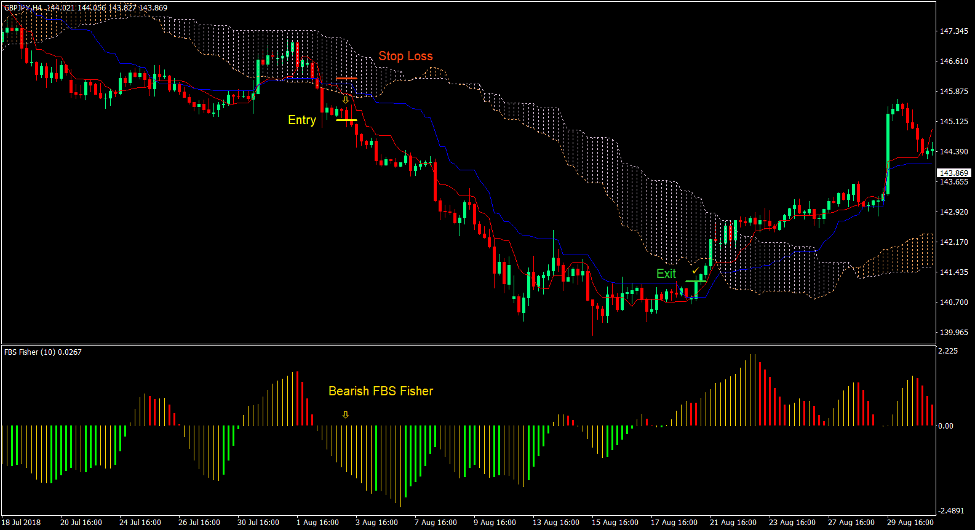
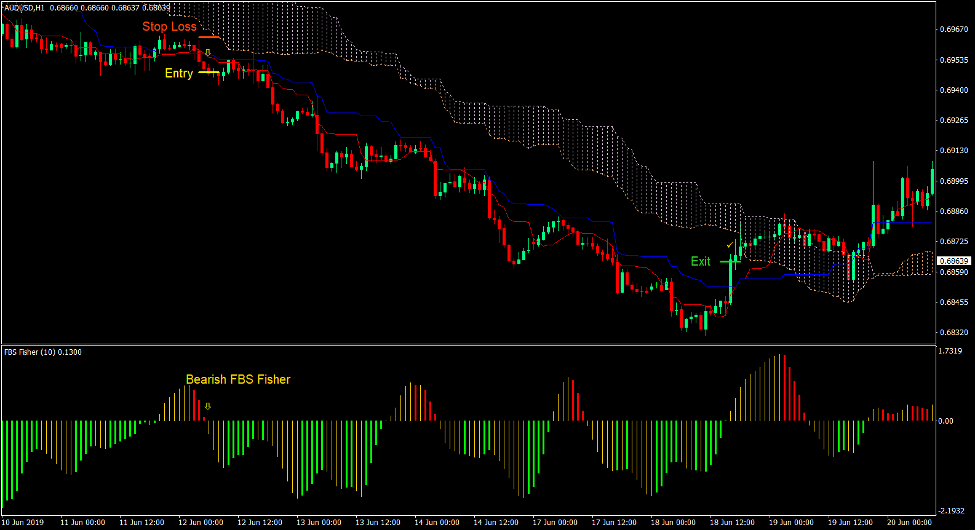
판매 거래 설정
기입
- Senkou Span A는 Senkou Span B 아래에 있어야 하고 Kumo는 엉겅퀴여야 합니다.
- 가격 조치는 하락 추세여야 합니다.
- 가격은 Kumo 쪽으로 후퇴하여 Tenkan-sen이 일시적으로 Kijun-sen과 FBS 피셔 막대 위로 교차하도록 합니다.
- FBS 피셔가 마이너스 금괴를 계획하고 텐칸센이 기준센 아래로 교차하는 즉시 매도 주문을 입력하십시오.
손실을 중지
- 진입 캔들 위의 저항에 손절매를 설정합니다.
출구
- 기준선 위에서 가격이 마감되는 즉시 거래를 마감하십시오.
결론
Ichimoku Kinko Hyo 지표는 그 자체로 완전한 거래 시스템이 될 수 있는 지표입니다. 실제로 Kumo와 정렬하면서 Tenkan-sen과 Kijun-sen 간의 교차는 일반적인 Ichimoku Kinko Hyo 전략으로 간주됩니다.
FBS 피셔는 트레이더가 승률을 높이는 데 사용할 수 있는 추가 확인 계층 역할을 합니다. 그러나 트레이더는 FBS 피셔 막대의 이동을 사용하여 진입 트리거 역할을 하도록 선택할 수도 있습니다. 이것은 보다 공격적인 방법이지만 거래자가 조금 더 많은 이익을 짜낼 수 있는 조기 진입을 의미할 수도 있습니다.
추천 MT4 브로커
XM 브로커
- 무료 $ 50 즉시 거래를 시작하려면! (인출가능이익)
- 입금 보너스 최대 $5,000
- 무제한 로열티 프로그램
- 수상 경력에 빛나는 외환 브로커
- 추가 독점 보너스 일년 내내

FBS 브로커
- 거래 100 보너스: 거래 여정을 시작하려면 $100를 무료로 받으세요!
- 100% 입금 보너스: 예치금을 최대 $10,000까지 두 배로 늘리고, 강화된 자본으로 거래하세요.
- 최대 1 활용 : 3000: 이용 가능한 가장 높은 레버리지 옵션 중 하나로 잠재적 이익을 극대화합니다.
- '아시아 최고의 고객 서비스 브로커' 상: 고객 지원 및 서비스의 우수성을 인정받았습니다.
- 계절별 프로모션: 1년 내내 다양한 독점 보너스와 프로모션 혜택을 누려보세요.

다운로드하려면 여기를 클릭하십시오.