


지지선과 저항선에 대한 이해는 기술 분석의 다른 핵심 요소와 함께 기술 트레이더가 가져야 하는 가장 기본적인 지식 중 하나일 것입니다. 이는 지지와 저항에 대한 이해가 거래자에게 반응형 거래자에서 가격이 어디로 움직일지, 어디로 반전될지, 멈출지 예측하는 사람으로 관점을 전환할 수 있는 기본 도구를 제공하기 때문입니다. 지지선과 저항선을 이해하는 트레이더는 종종 가격 움직임을 쫓기보다 시장에 진입할 최적의 영역을 기다리는 관점을 가지고 있습니다.
아래에서 논의할 전략은 지지선과 저항선을 사용하여 가격이 반전될 수 있는 가격 차트의 주요 위치를 예측하는 방법의 예입니다. 또한 Fisher RVI 표시기를 추가 도구로 사용하여 거래 항목을 확인합니다.
스윙 하이 – 스윙 로우 지원 및 저항 영역
지지선과 저항선을 그릴 때 트레이더마다 접근 방식이 다릅니다. 어떤 사람들은 대각선 추세선을 지지와 저항의 기초로 사용하는 반면, 다른 사람들은 수평 지지와 저항 수준만 고려합니다. 심지를 기준으로 선을 그리는 사람도 있고 양초 몸체를 기준으로 선을 그리는 사람도 있습니다.
그러나 많은 전문 트레이더가 지지선과 저항선을 그릴 때 사용하는 가장 효과적인 방법 중 하나는 주요 스윙 고점과 스윙 저점을 보고 지지선과 저항선 영역을 그리는 것입니다. 가격이 과거에 이미 그 수준에서 반전되었기 때문에 이것은 매우 논리적인 접근 방식입니다. 그런 다음 많은 트레이더가 해당 지역에서 구매 또는 판매를 찾고 있다고 가정할 수 있습니다.
일부 트레이더는 이러한 영역을 수요와 공급 영역이라고 부릅니다. 이는 가격 변동을 유발하는 반전이 해당 영역에 공급 또는 수요가 있음을 나타내기 때문에 이해할 수 있습니다.
다른 노련한 거래자들은 그것을 주문 블록이라고 부르며, 엄청난 수의 주문이 채워지고 기관 수준에서 더 많은 대기 중인 주문이 채워지기를 기다리고 있는 영역이었기 때문에 정당하게 그렇게 불렀습니다.
단순화를 위해 지원 및 저항 영역이라고 부르겠습니다. 선 대신 영역이라고 했습니다. 이는 반전이 일반적으로 정확하지 않기 때문입니다. 트레이더마다 거래를 하려는 가격 수준이 다르기 때문입니다.
이를 위해 우리는 주요 스윙 고점과 스윙 저점의 정체 구간에 주목해야 합니다. 그런 다음 가격이 반전된 영역을 지지 또는 저항 영역으로 표시할 수 있습니다.

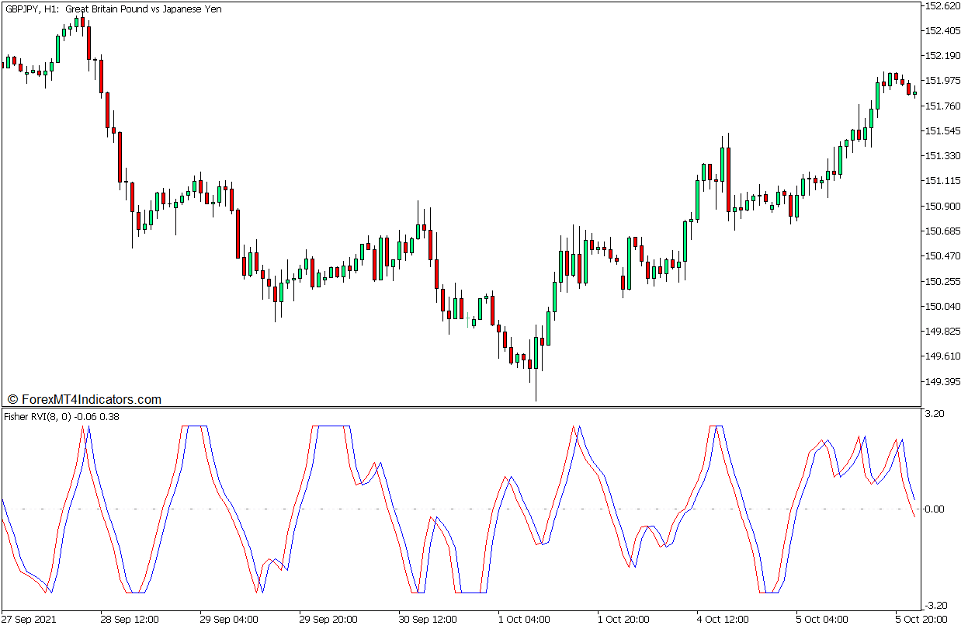
피셔 RVI 표시기
Fisher RVI 지표는 2002년 XNUMX월 "Technical Analysis of Stock and Commodities" 잡지에 게재된 John Ehlers의 기사 "Using the Fisher Transform"에서 논의한 개념을 기반으로 하는 맞춤형 기술 지표입니다. 그러나 지표는 원래 Witold Wozniak에 의해 개발되었습니다.
이 지표는 John Ehlers가 논의한 역 피셔 변환의 개념을 사용하여 기본 RVI(Relative Vigor Index) 지표를 수정합니다. 이것은 기본 RVI 지표를 개선하여 지표가 최근 과거 가격을 기반으로 가격 극단을 강조하고 반전 신호를 제공할 수 있도록 합니다.
이 지표는 XNUMX인 중간선 주위를 진동하는 두 개의 선을 그립니다. 빨간색 선은 기본 Fisher RVI 선이고 파란색 선은 Trigger 선입니다. 모멘텀 방향은 Trigger 라인과 관련된 Fisher RVI 라인의 위치로 표시됩니다. 시장이 극단적인 가격에 있을 때마다 범위의 상단 또는 하단에서 선이 평평해집니다. 두 선 사이의 교차는 또한 일반적으로 시장 모멘텀이 잠재적으로 역전될 수 있음을 나타냅니다.
거래 전략 개념
MT5에 대한 Fisher RVI 지지 및 저항 반전 외환 거래 전략은 지지 및 저항 영역에서 잠재적인 가격 반전을 예상하고 Fisher RVI 지표를 모멘텀 반전 신호로 사용하는 모멘텀 반전 거래 전략입니다.
이를 위해 트레이더는 먼저 최근 주요 스윙 고점과 스윙 저점이 어디인지 파악해야 합니다. 그런 다음 트레이더는 스윙 고점과 스윙 저점에 형성된 정체 구간을 표시하여 지지 또는 저항 영역을 표시해야 합니다.
다음 단계는 가격이 해당 지역을 다시 방문하기를 기다리는 것입니다. Fisher RVI 지표가 해당 지역에 있는 동안 과매수 또는 과매도 시장 상황을 나타내면 잠재적인 모멘텀 반전을 예상할 수 있습니다.
진입 신호는 피셔 RVI 라인과 그 트리거 라인이 가격 움직임과 합류하는 크로스오버가 될 것이며 삼켜지는 양초로 표시되는 모멘텀 반전의 신호를 보여줍니다.
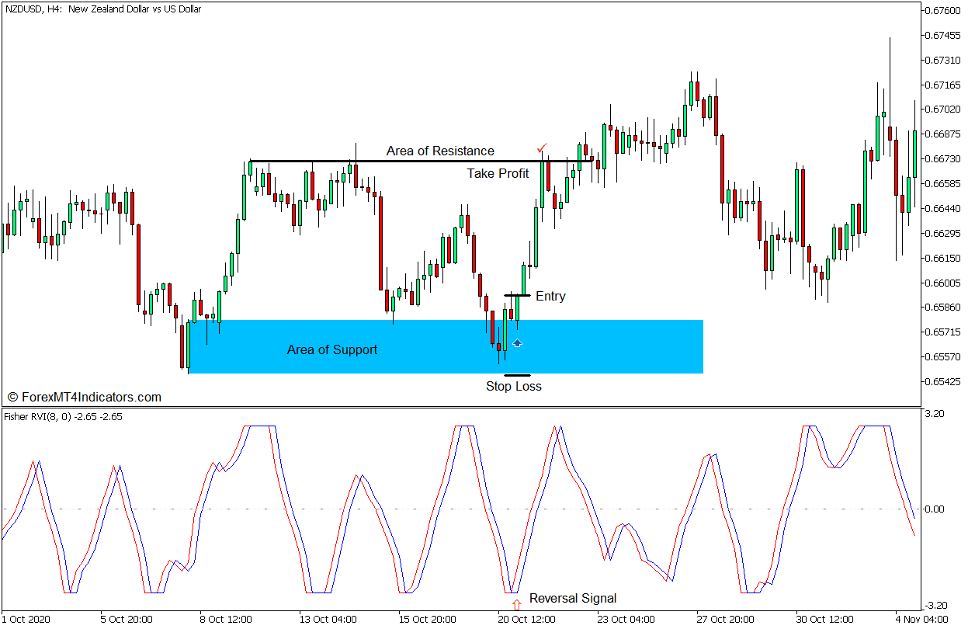
거래 설정 구매
기입
- 가장 최근 주요 스윙의 정체 구역을 지원 구역으로 표시하십시오.
- 가격이 해당 지역을 다시 방문할 때까지 기다립니다.
- Fisher RVI 라인은 해당 범위의 바닥에서 평평해야 합니다.
- 강세 모멘텀 반전 가격 행동과 파란색 선 위의 빨간색 Fisher RVI 선이 교차하는 지점에서 매수 주문을 시작하세요.
손실을 중지
- 지원 영역 아래에 손절매를 설정하십시오.
출구
- 다음 레지스탕스 지역에서 이익 실현 목표를 설정하십시오.
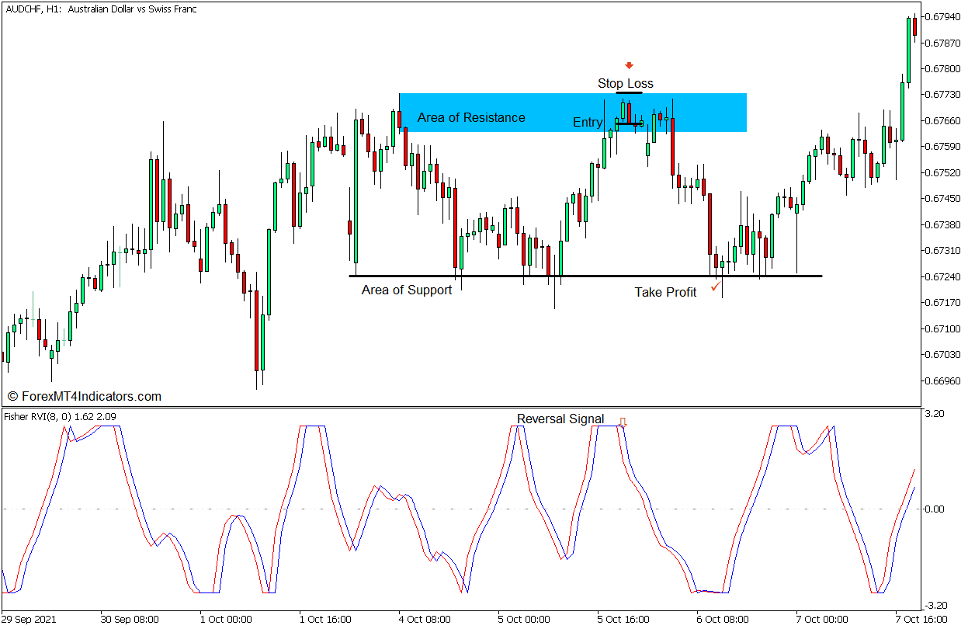
판매 거래 설정
기입
- 저항 영역으로 가장 최근의 주요 스윙 높이의 혼잡 영역을 표시합니다.
- 가격이 해당 지역을 다시 방문할 때까지 기다립니다.
- Fisher RVI 라인은 해당 범위의 상단에서 평평해야 합니다.
- 약세 모멘텀 반전 가격 행동과 파란색 선 아래의 빨간색 Fisher RVI 선이 교차하는 지점에서 매도 주문을 시작하세요.
손실을 중지
- 저항 영역 위에 손절매를 설정하십시오.
출구
- 다음 지원 영역에서 이익 실현 목표를 설정하십시오.
결론
이러한 유형의 거래 전략은 시장 흐름 거래자와 공급 및 수요 거래자가 일반적으로 사용합니다. 그러나이 방법은 언급 된 두 가지 기본 전략 유형에 약간의 수정이 있습니다. 이 전략은 Fisher RVI를 거래 항목에 대한 확인 신호로 사용합니다. 이를 통해 거래자는 거래를 시작하기 위한 객관적인 기반을 가질 수 있습니다.
이러한 거래 스타일은 시장을 거래하는 매우 효과적인 방법이 될 수 있습니다. 그러나 트레이더는 이 전략을 효과적으로 사용하기 위해 주요 지원 및 저항 영역을 올바르게 식별하는 방법을 배우는 것이 중요합니다.
추천 MT5 브로커
XM 브로커
- 무료 $ 50 즉시 거래를 시작하려면! (인출가능이익)
- 입금 보너스 최대 $5,000
- 무제한 로열티 프로그램
- 수상 경력에 빛나는 외환 브로커
- 추가 독점 보너스 일년 내내

FBS 브로커
- 거래 100 보너스: 거래 여정을 시작하려면 $100를 무료로 받으세요!
- 100% 입금 보너스: 예치금을 최대 $10,000까지 두 배로 늘리고, 강화된 자본으로 거래하세요.
- 최대 1 활용 : 3000: 이용 가능한 가장 높은 레버리지 옵션 중 하나로 잠재적 이익을 극대화합니다.
- '아시아 최고의 고객 서비스 브로커' 상: 고객 지원 및 서비스의 우수성을 인정받았습니다.
- 계절별 프로모션: 1년 내내 다양한 독점 보너스와 프로모션 혜택을 누려보세요.

다운로드하려면 여기를 클릭하십시오.