


시장 반전은 가격 조치와 가격 패턴을 기반으로 식별할 수 있습니다. 이것은 대부분의 노련한 거래자들이 사용하는 방법입니다. 그러나 초보 거래자들은 일반적으로 자신의 관찰을 바탕으로 가능한 추세 반전을 식별하는 것이 어렵다는 것을 알게 됩니다.
Elliott Wave Oscillator 및 최고 고점 – 최저 최저 SR 지표와 같은 기술 지표를 사용하여 가격 조치가 무엇인지 객관적으로 식별하고 확인하는 방법을 살펴보겠습니다. 여기에서 논의된 전략은 두 지표를 기반으로 한 추세 반전 전략을 보여 주며, 이는 가격 조치에 따른 추세 반전 개념과 일치합니다.
엘리엇 파동 발진기 표시기
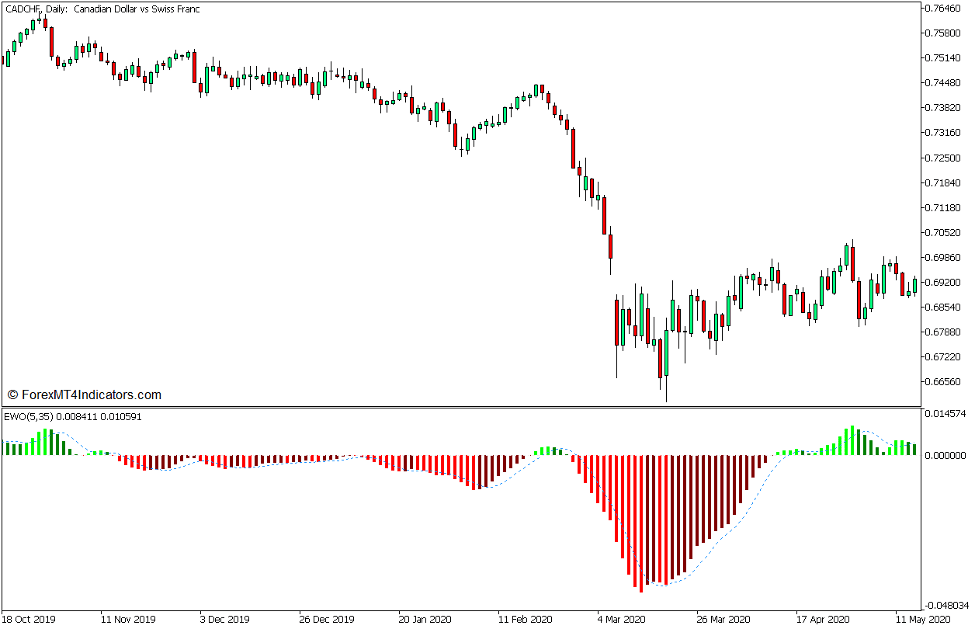
EWO(Elliott Wave Oscillator)는 Elliott Wave 이론을 기반으로 개발된 모멘텀 지표입니다. 엘리엇 파동 이론의 저자인 랄프 넬슨 엘리엇(Ralph Nelson Elliot)은 가격이 일반적인 패턴에 따라 움직인다는 점을 관찰했습니다. 이 이론은 거래자가 패턴을 기반으로 다음 가격 움직임의 방향을 예측할 수 있고 가격 움직임이 식별된 패턴과 관련되어 있음을 시사합니다. 패턴은 반복 가능하지만 가격 급등 및 변동성과 같은 시장 소음은 종종 거래자를 오도하여 잘못된 반전 신호를 초래할 수 있습니다. 이러한 이유로 Elliott는 거래자가 가격 변동을 추적하고 관찰하면서 이를 EWO 막대의 변동과 비교할 수 있도록 하여 거래자가 시장 변동 및 반전을 객관적으로 식별할 수 있도록 돕기 위해 EWO를 개발했습니다.
EWO 지표는 두 개의 이동 평균선을 사용하여 표시되는 값, 특히 5바 단순 이동 평균(SMA)과 34바 SMA를 계산합니다. 두 SMA 라인의 값을 사용하여 5 SMA 라인과 34 SMA 라인 간의 차이를 계산합니다. 그런 다음 이 값을 히스토그램 막대를 그리기 위한 기초로 사용합니다. 따라서 EWO 지표의 주요 공식은 다음과 같습니다.
EWO = 5 SMA – 34 SMA
이 버전의 EWO는 추세의 방향은 물론 추세의 약화 또는 강화를 나타내기 위해 막대의 색상을 수정합니다. 이전 막대보다 큰 값을 갖는 양수 값을 인쇄할 때마다 라임 막대를 표시하고 값이 감소하는 양수 막대를 인쇄할 때마다 녹색 막대를 표시합니다. 반면에 감소하는 값으로 음수 막대를 인쇄할 때마다 빨간색 막대를 표시하고 양수 값으로 음수 막대를 인쇄할 때마다 적갈색 막대를 표시합니다.
이 버전에는 표시기가 EWO 막대의 이동 평균을 계산하는 기능도 있습니다. 그런 다음 오실레이터 막대의 움직임을 모방하는 점선으로 이동 평균 값을 표시합니다. 이 점선은 신호선으로 사용될 수 있습니다.
최고 최고 – 최저 최저 SR 표시기
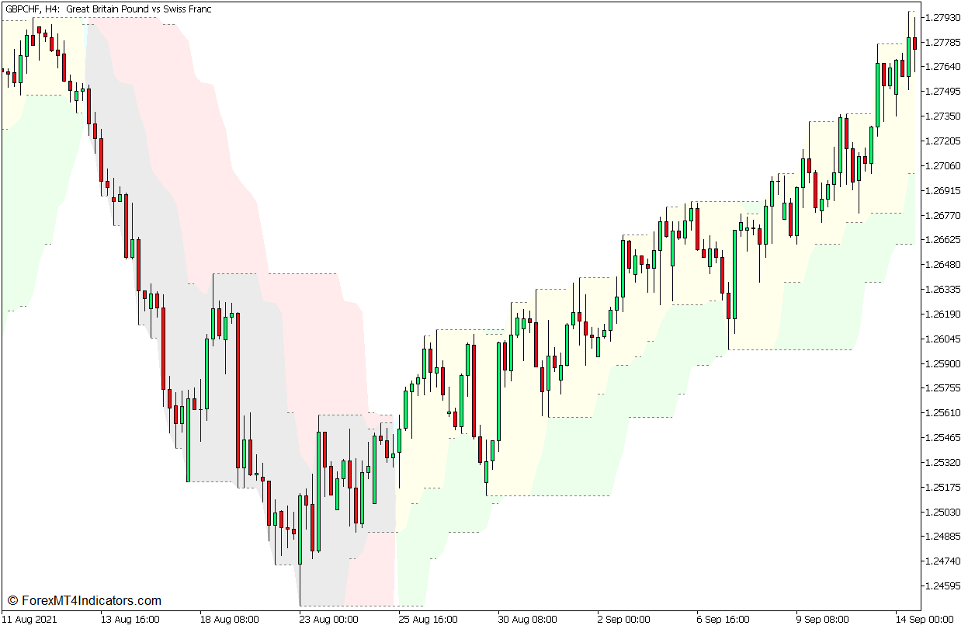
최고 고점 – 최저 최저 SR 지표는 거래자가 지지 및 저항 수준은 물론 가격 조치에 따른 추세 방향을 식별하는 데 도움을 주기 위한 맞춤형 기술 지표입니다.
이니셜 "SR"은 실제로 "지지와 저항"을 의미합니다. 이름에서 알 수 있듯이 최고 고점 – 최저 최저 SR 지표는 최고 고점과 최저 최저점을 기준으로 지지 및 저항 수준을 식별하는 도구입니다. 이 지표는 일련의 양초에서 최고점과 최저점을 식별하기 위해 가격의 최고점과 최저점을 비교하는 알고리즘을 사용합니다. 확인된 최고점과 최저점은 확인된 지지선과 저항선인 점선을 그리는 기초로 사용됩니다.
덧붙여서, 가격 움직임을 사용하여 추세 방향을 파악할 수 있다는 점을 고려하면 이 지표에는 거래자가 추세 방향을 식별하는 데 도움이 되는 기능도 있습니다. 지지선과 저항선 사이의 영역을 노란색과 녹색으로 음영 처리하여 강세 추세를 나타내고 보라색과 분홍색으로 음영 처리하여 약세 추세를 나타냅니다. 이 추세 방향은 상승 추세를 나타내는 더 높은 고점을 돌파하거나 하락 추세를 나타내는 더 낮은 저점 아래로 떨어지는 가격 행동을 기반으로 합니다.
거래 전략 개념
Elliott Wave Oscillator 반전 브레이크아웃 외환 트레이딩 전략은 Higher Highs – Lower Lows SR 및 Elliott Wave Oscillator 지표를 기반으로 하는 추세 반전 거래 전략입니다.
고점 상승 – 저점 하강 SR 지표는 가격 변동의 반전을 식별하는 데 사용됩니다. 이는 더 높은 고점을 돌파하거나 더 낮은 저점 아래로 떨어지는 가격 움직임을 기반으로 추세 방향을 식별할 수 있다는 개념을 기반으로 합니다. 이를 위해 우리는 확인된 지지선이나 저항선을 넘어 현재 추세 방향과 반대로 움직이는 강력한 모멘텀을 지닌 양초를 관찰할 것입니다. 또한 이 조치로 인해 표시기는 해당 영역을 잠재적인 추세 반전을 나타내는 다른 색상으로 음영 처리합니다.
그런 다음 Elliott Wave Oscillator는 식별된 잠재적 추세 반전의 확인 신호로 사용됩니다. 추세 방향과 강도는 히스토그램 막대가 양수인지 음수인지와 표시되는 막대의 색상을 기준으로 식별됩니다.
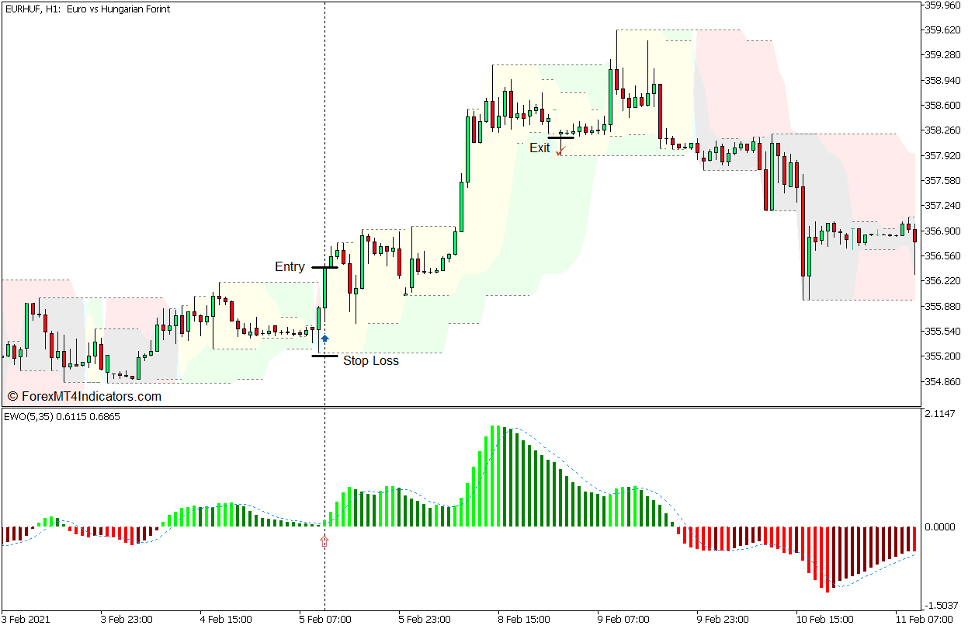
거래 설정 구매
기입
- 강한 강세 모멘텀 캔들은 고점 – 저점 SR 지표로 식별되는 주요 스윙 고저항 위에서 마감되어야 합니다.
- Elliott Wave Oscillator는 신호선 위에 양의 라임 바를 표시해야 합니다.
- 이러한 조건이 확인되면 구매 주문을 개설하세요.
손실을 중지
- 더 높은 고점 – 더 낮은 저점 SR 표시기로 식별되는 지원 수준 아래로 정지 손실을 설정하십시오.
출구
- 이익이 중단될 때까지 가격 조치 뒤의 한두 가지 지원 수준에서 손절매를 추적합니다.
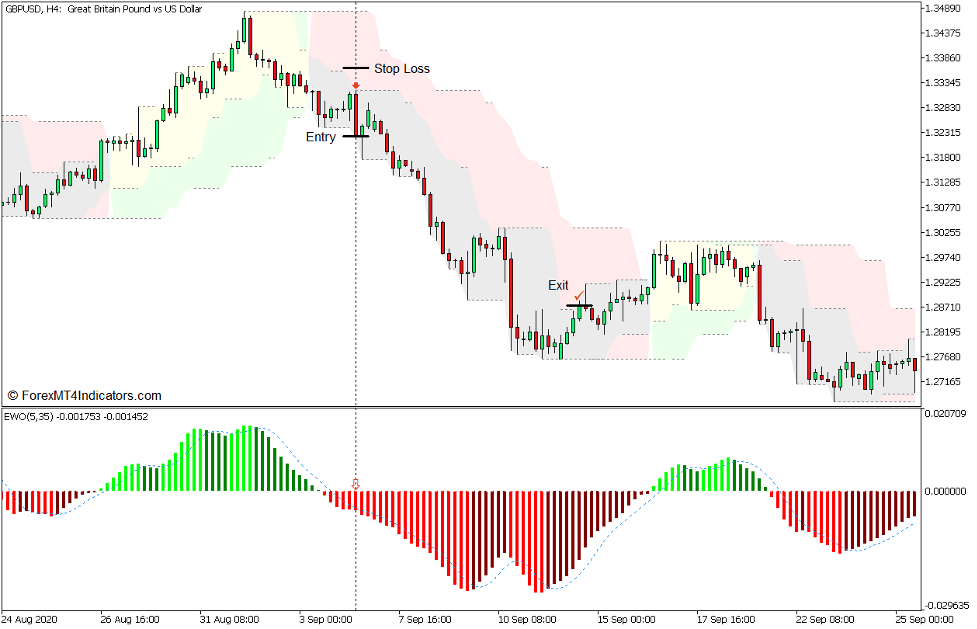
판매 거래 설정
기입
- 강한 약세 모멘텀 캔들은 고점 – 저점 SR 지표로 식별되는 주요 스윙 저점 아래에서 마감되어야 합니다.
- Elliott Wave Oscillator는 신호 라인 아래에 음의 빨간색 막대를 표시해야 합니다.
- 이러한 조건이 확인되면 매도 주문을 개시하세요.
손실을 중지
- Higher Highs – Lower Lows SR 표시기로 식별된 저항 레벨 이상으로 정지 손실을 설정하십시오.
출구
- 이익이 중단될 때까지 가격 조치 뒤의 한두 가지 지원 수준에서 손절매를 추적합니다.
결론
스윙 고점 또는 스윙 저점 돌파를 기반으로 추세 반전을 식별하는 것은 추세 반전을 발견하는 효과적인 방법입니다. 이 전략은 기술 지표를 사용하여 이러한 반전 신호를 식별하는 프로세스를 단순화하여 객관적이고 논리적인 반전 거래 신호를 생성합니다.
이 전략은 가격 움직임과 추세 반전 신호를 이해하는 데 가장 효과적입니다. 스윙 최고점과 최저점을 기반으로 지지와 저항 수준을 파악할 수 있는 트레이더는 이러한 유형의 전략을 거래하는 데 더 효과적일 것입니다.
추천 MT5 브로커
XM 브로커
- 무료 $ 50 즉시 거래를 시작하려면! (인출가능이익)
- 입금 보너스 최대 $5,000
- 무제한 로열티 프로그램
- 수상 경력에 빛나는 외환 브로커
- 추가 독점 보너스 일년 내내

FBS 브로커
- 거래 100 보너스: 거래 여정을 시작하려면 $100를 무료로 받으세요!
- 100% 입금 보너스: 예치금을 최대 $10,000까지 두 배로 늘리고, 강화된 자본으로 거래하세요.
- 최대 1 활용 : 3000: 이용 가능한 가장 높은 레버리지 옵션 중 하나로 잠재적 이익을 극대화합니다.
- '아시아 최고의 고객 서비스 브로커' 상: 고객 지원 및 서비스의 우수성을 인정받았습니다.
- 계절별 프로모션: 1년 내내 다양한 독점 보너스와 프로모션 혜택을 누려보세요.

다운로드하려면 여기를 클릭하십시오.