


시장 추세는 종종 지속적으로 상승하거나 하락하는 스윙 하이 또는 스윙 로우를 기반으로 식별됩니다. 프라이스 액션 트레이더는 상승하는 스윙 고점을 기반으로 상승 추세를 식별하고 스윙 저점 하락을 기반으로 하는 하락 추세를 식별합니다. 이 방법은 매우 효과적일 수 있지만 초보 트레이더는 스윙 고점과 스윙 저점을 기반으로 추세 방향을 객관적으로 식별하는 데 어려움을 겪을 수 있습니다. 아래에서 논의되는 전략은 더 높은 고점과 더 낮은 저점을 기반으로 추세 방향을 객관적으로 식별하는 지표를 사용합니다.
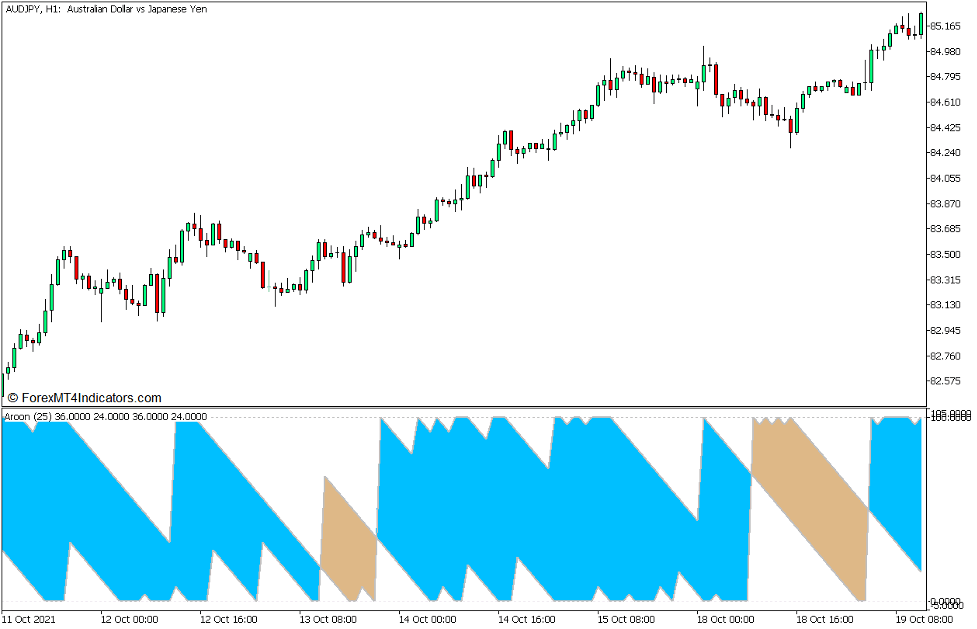
Aroon 표시기
Aroon 지표는 1995년 Tusar Chande가 개발한 모멘텀 기술 지표입니다. 이 지표는 트레이더가 추세 방향과 변화, 해당 추세의 강도를 식별하는 데 도움을 주기 위해 만들어졌습니다.
거래자들은 종종 최고점과 최저점을 형성하는 가격 행동을 기반으로 추세를 식별합니다. 상승 추세 시장은 더 높은 스윙 고점과 스윙 저점을 지속적으로 생성하는 가격 행동을 기반으로 식별됩니다. 반면에 하락 추세는 낮은 스윙 저점과 스윙 고점을 지속적으로 형성하는 가격 행동을 기반으로 식별됩니다. Aroon Indicator가 추세 방향을 감지하는 방식은 이 개념과 밀접한 관련이 있습니다.
Aroon Indicator는 핍이나 포인트를 기준으로 가격의 수직 거리를 측정하지 않습니다. 대신 막대 수를 기준으로 계산되는 시간을 기준으로 가격의 고점과 저점 사이의 거리를 수평으로 측정합니다.
Aroon 표시기는 Aroon Up 및 Aroon Down 선인 두 개의 선을 그립니다. Aroon Up 라인은 새로운 100바 높이를 감지할 때마다 포인트를 25으로 표시합니다. 그런 다음 라인은 새로운 고점을 감지할 때까지 지속적으로 하락하며, 이 경우 100까지 다시 급상승합니다. 25바 창 내에서 새로운 고점이 감지되지 않으면 라인이 100으로 떨어집니다. 동일한 프로세스가 Aroon Down 라인에도 적용되지만 새로운 최고점에 라인을 100에 표시하는 대신 새로운 최저점에 라인을 XNUMX에 표시합니다. 이를 위해 Aroon Indicator는 아래 공식을 사용하여 해당 라인의 포인트를 계산합니다.
Aroon Up = [(25 – 25주기 최고 이후 기간) / 25] * 100
Aroon Down = [(25 – 25기간 최저 이후 기간) / 25] * 100
이것은 시장이 지속적으로 새로운 최고점을 만드는 시나리오에서 새로운 최저점을 만들기 시작하는 시나리오 또는 그 반대의 시나리오로 반전될 때마다 교차하는 두 개의 선을 만듭니다. 이러한 크로스오버는 추세 반전으로 해석될 수 있습니다.
지표는 두 선 사이의 영역을 음영 처리하여 이러한 추세 반전을 식별하는 프로세스를 단순화합니다. 상승 추세를 나타내기 위해 영역을 하늘색으로 음영 처리하고 하락 추세를 나타내기 위해 갈색으로 음영 처리합니다.
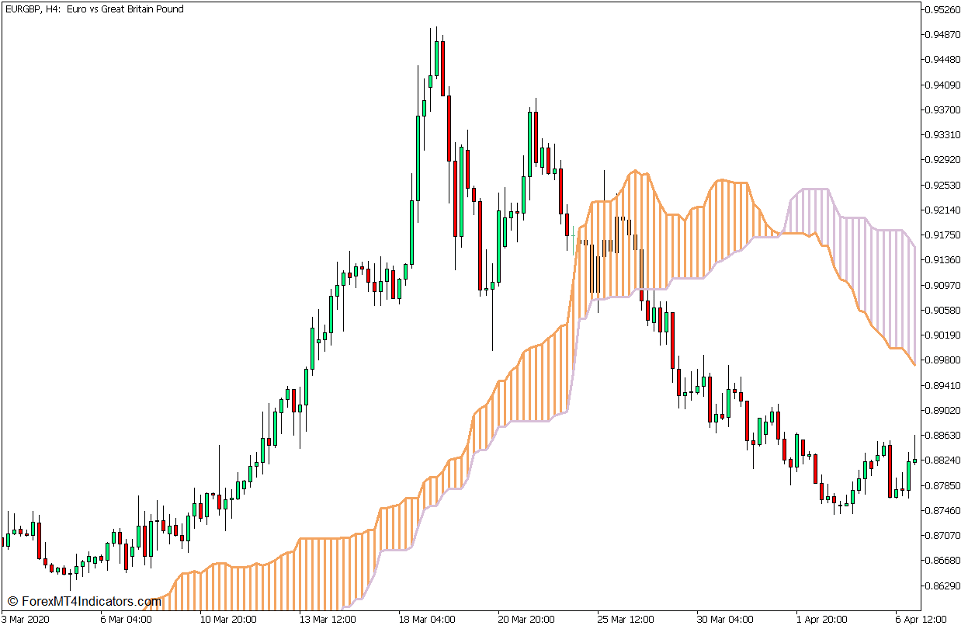
이치모쿠 킨코 효 - 쿠모
"클라우드"를 의미하는 Kumo는 Ichimoku Kinko Hyo 기술 지표 시스템의 구성 요소입니다. 장기 추세 방향을 감지하는 데 사용되는 시스템의 구성 요소입니다.
Kumo는 Leading Span A(Senkou Span A)와 Leading Span B(Senkou Span B) 라인으로 구성됩니다. Leading Span A 라인은 9바 창 내 가격의 중앙값인 Ichimoku Kinko Hyo의 변환 라인과 26바 창 내 가격의 중앙값인 Base Line의 평균입니다. 반면 Leading Span B는 52바 창 내 가격의 중앙값에 해당합니다. 아래 공식을 사용하여 Senkou Span A 및 Senkou Span B 선을 그립니다.
전환선 = (9일 고점 + 9일 저점) / 2
기준선 = (26일 고점 + 26일 저점) / 2
선행 스팬 A = (전환선 + 기준선) / 2
선행 스팬 B = (52일 고점 + 52일 저점) / 2
Kumo는 Leading Span A 라인이 Leading Span B 라인 위에 있을 때마다 갈색으로 음영 처리되어 상승 추세를 나타냅니다. 반대로 Leading Span A 라인이 Leading Span B 라인 아래에 있을 때마다 엉겅퀴로 음영 처리됩니다.
거래 전략 개념
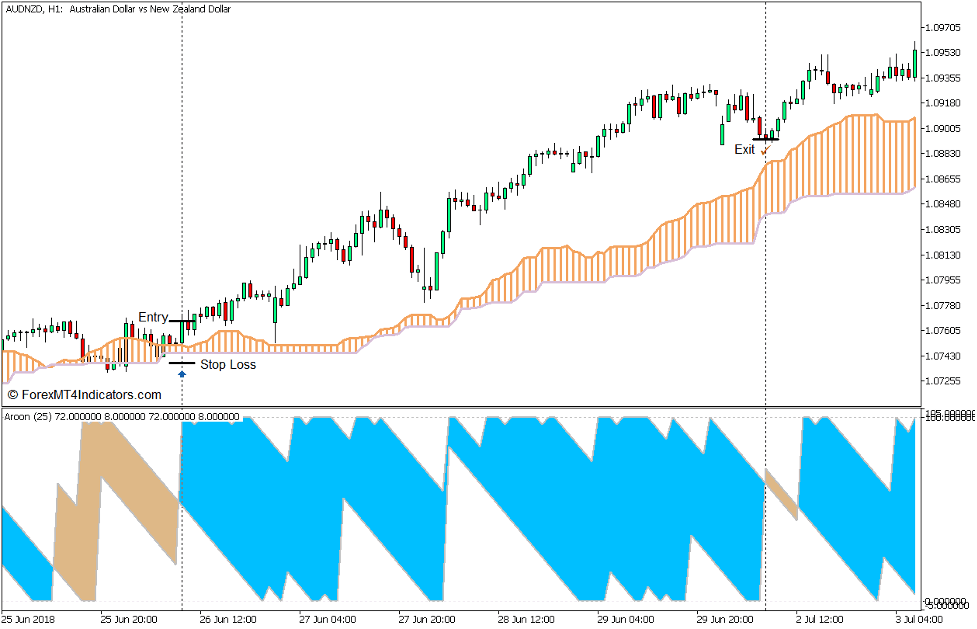
Aroon Up and Down Trend Follow Forex Trading Strategy는 장기 추세와 단기 추세 사이의 합류점을 사용하여 거래 설정에 따라 가능한 높은 확률 추세를 식별하고 감지하는 추세 추종 거래 전략입니다.
전략의 Kumo 구성 요소는 거래자가 장기 추세 방향을 식별하는 데 사용됩니다. 이것은 두 선 사이의 음영 영역의 색상을 기반으로 합니다. 거래 방향은 Kumo가 나타내는 추세 방향으로 만 격리됩니다.
거래 방향이 확인되면 Aroon Up 및 Aroon Down 라인이 교차할 때마다 Kumo가 나타내는 장기 추세 방향과 합류하는 추세 반전 신호를 나타내는 거래 신호가 식별됩니다.
거래 설정 구매
기입
- Kumo는 장기 강세 추세 시장을 나타내는 음영 처리된 갈색이어야 합니다.
- 두 Aroon 라인 사이의 영역이 강세 추세 반전을 나타내는 하늘색으로 음영 처리되는 즉시 구매 주문을 엽니다.
손실을 중지
- Kumo 아래에 손절매를 설정하십시오.
출구
- 두 Aroon 라인 사이의 영역이 잠재적인 약세 반전을 나타내는 갈색으로 바뀌는 즉시 거래를 마감하십시오.
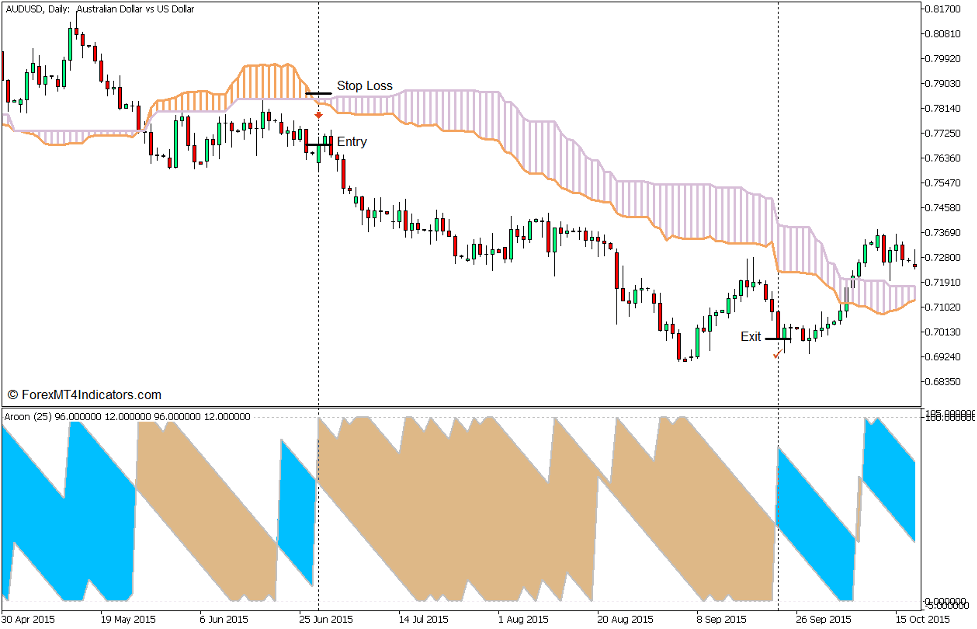
판매 거래 설정
기입
- Kumo는 장기 약세 추세 시장을 나타내는 그늘진 엉겅퀴여야 합니다.
- 두 Aroon 라인 사이의 영역이 약세 추세 반전을 나타내는 갈색 음영으로 표시되자마자 매도 주문을 엽니다.
손실을 중지
- Kumo 위에 손절매를 설정하십시오.
출구
- 두 Aroon 라인 사이의 영역이 잠재적인 강세 반전을 나타내는 하늘색으로 변경되는 즉시 거래를 마감하십시오.
결론
추세 추종 전략은 트레이더가 막대한 이익을 얻을 수 있는 경우가 많기 때문에 훌륭한 트레이딩 기회가 될 수 있습니다. 그러나 추세 추종 전략은 모든 시장 조건에 적용할 수 없기 때문에 일부 트레이더에게는 혼란을 야기할 수도 있습니다. 추세 시장에서는 효과적이지만 범위가 넓은 시장이나 명확한 추세 방향이 없는 시장에서는 효과가 없습니다.
거래 신호가 장기 추세 편향과 단기 추세 편향의 합류점을 기반으로 하는 경우 추세 추종 전략의 승리 확률이 향상될 수 있습니다. 이 전략은 Kumo와 Aroon 지표의 합류점에서만 거래함으로써 이 방법을 적용합니다.
추천 MT5 브로커
XM 브로커
- 무료 $ 50 즉시 거래를 시작하려면! (인출가능이익)
- 입금 보너스 최대 $5,000
- 무제한 로열티 프로그램
- 수상 경력에 빛나는 외환 브로커
- 추가 독점 보너스 일년 내내

FBS 브로커
- 거래 100 보너스: 거래 여정을 시작하려면 $100를 무료로 받으세요!
- 100% 입금 보너스: 예치금을 최대 $10,000까지 두 배로 늘리고, 강화된 자본으로 거래하세요.
- 최대 1 활용 : 3000: 이용 가능한 가장 높은 레버리지 옵션 중 하나로 잠재적 이익을 극대화합니다.
- '아시아 최고의 고객 서비스 브로커' 상: 고객 지원 및 서비스의 우수성을 인정받았습니다.
- 계절별 프로모션: 1년 내내 다양한 독점 보너스와 프로모션 혜택을 누려보세요.

다운로드하려면 여기를 클릭하십시오.