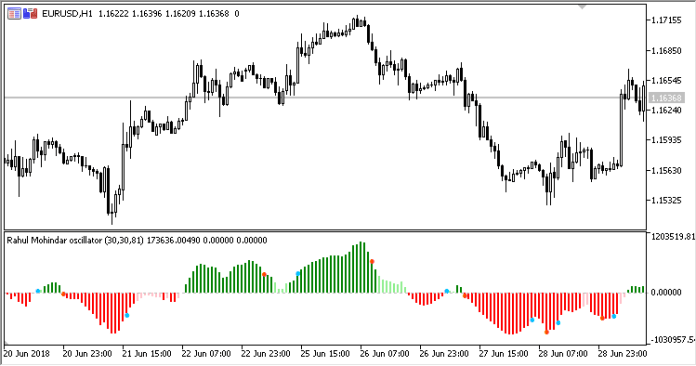
Rahul Mohindar Oscillator (RMO) is a versatile technical indicator that has gained popularity among traders. Developed by Rahul Mohindar, this indicator provides valuable insights into market trends and potential reversal zones. In this article, we’ll delve into the details of the RMO, exploring its significance, functionality, and practical application.
どうしてそれが重要ですか?
Understanding market trends is crucial for successful trading. The RMO helps traders identify the prevailing trend direction, allowing them to align their strategies accordingly. By analyzing price movements, the RMO assists in making informed decisions, whether you’re a novice or an experienced trader.
それはどのように動作しますか?
The RMO combines elements of moving averages and swing trading to create a dynamic oscillator. Let’s break down its components:
- Swing Trading (SwingTrd): SwingTrd calculates the percentage difference between the current price and a moving average. It quantifies the market’s momentum and volatility.
- First EMA: Determines the short-term trend.
- Second EMA: Captures medium-term price movements.
- Third EMA: Reflects longer-term trends.
- Applied Price: The RMO considers the average of the current and previous applied prices.
どのように理解すればよいでしょうか?
RMO appears as a color histogram with signal pointers. Positive values indicate bullish momentum, while negative values suggest bearish sentiment. Pay attention to crossovers between the fast-RMO (green line) and the slow-RMO (dotted line). Bullish crossovers occur when the fast-RMO crosses above the slow-RMO, signaling a potential uptrend. Conversely, bearish crossovers indicate a possible downtrend.
発散パターン
Divergences between price movements and the RMO can provide valuable clues about potential trend reversals. Here’s how to interpret them, When the price makes lower lows, but the RMO shows higher lows, it signals a potential bullish reversal.
This divergence suggests that despite falling prices, momentum is shifting upward, indicating a possible trend change. Conversely, bearish divergence occurs when the price forms higher highs while the RMO records lower highs. This scenario hints at a bearish reversal, where prices may soon decline. Keep an eye out for these divergence patterns, especially near critical support or resistance levels.
Volatility Expansion
The RMO’s sensitivity to volatility makes it a powerful tool during market turbulence. During periods of heightened volatility, the RMO can exhibit extreme values. Pay attention to these spikes, as they often precede significant price movements. When the RMO reaches extreme levels (either positive or negative), it could signal an imminent trend shift. Think of the RMO as an early warning system. If you notice extreme RMO readings, consider adjusting your trading strategy accordingly. Volatility expansion can lead to rapid price changes, so be prepared.
How to Trade with Rahul Mohindar Osc Indicator
エントリーを購入する
- Look for a bullish crossover between the fast-RMO (green line) and the slow-RMO (dotted line). This occurs when the fast RMO crosses above the slow RMO.
- Confirm the bullish signal by checking if the RMO histogram is positive.
- エントリーポイント: Buy when the above conditions align.
- ストップロス: Set the stop-loss just below the recent swing low or a key support level.
- テイクプロフィット: 次の重要なレジスタンスレベルをターゲットにするか、トレーリングストップを使用してトレンドが続くときに利益を獲得します。
売りエントリー
- Look for a bearish crossover between the fast-RMO and slow-RMO. This happens when the fast RMO crosses below the slow RMO.
- Confirm the bearish signal by checking if the RMO histogram is negative.
- エントリーポイント: Sell when the above conditions align.
- ストップロス: Place the stop-loss just above the recent swing high or a major resistance level.
- テイクプロフィット: Aim for the next substantial support level or use a trailing stop to secure gains during the downtrend.
まとめ
Rahul Mohindar Oscillator is a valuable tool for traders seeking clarity in complex markets. By mastering its interpretation and integrating it into your trading routine, you can enhance your decision-making process and stay ahead of market trends. Remember to combine the RMO with other indicators for a comprehensive analysis.
おすすめのMT5ブローカー
XMブローカー
- 無料$ 50 すぐに取引を開始するには! (出金可能利益)
- までのデポジットボーナス $5,000
- 無制限のロイヤルティプログラム
- 受賞歴のある外国為替ブローカー
- 追加の独占ボーナス 年間を通じて
>> ここからXMブローカーアカウントにサインアップしてください<
FBSブローカー
- トレード100ボーナス: 100 ドルを無料で取引の旅を始めましょう!
- 100%の入金ボーナス: 入金額を最大 $10,000 まで XNUMX 倍にし、強化された資本で取引します。
- 1まで活用する:3000: 利用可能な最高のレバレッジ オプションの 1 つで潜在的な利益を最大化します。
- 「アジアのベストカスタマーサービスブローカー」賞: カスタマーサポートとサービスの優秀性が認められています。
- 季節のプロモーション: 一年中、さまざまな限定ボーナスやプロモーション特典をお楽しみいただけます。
>> ここからFBSブローカーアカウントにサインアップしてください<
(MT5 インジケーターの無料ダウンロード)
ダウンロードするには、以下をクリックしてください。


