


多くの新しいトレーダーが外国為替市場から利益を得るのが非常に難しいと感じる理由の XNUMX つは、トレンドの方向にトレードしないためです。 場合によっては、トレンドとの取引に適していない戦略を持っていることが問題です。 多くの場合、それはトレンドの終わりに取引を行うことへの恐れによるものです。
トレーダーがトレンドを追うことを避けるべきであることは事実ですが、トレンドの方向への取引は、トレンドの開始時ではなく、トレンドの途中で取引する必要があることも意味します. 確かに、トレードがトレンドの開始時に行われた場合ほど利回りは高くないかもしれません。 確かに、トレンドがすぐに逆転するリスクがあります。 ただし、トレンドに沿って取引することは、勝つ可能性が高い取引を意味する可能性もあります。
一方で、トレンドの反転を予測することも大きなリスクを伴います。 取引はトレンドの開始時に行われるため、取引の利回りが高くなることは事実ですが、価格の反転としてトレンドの反転を捉えることも非常に困難になる可能性があります。
オラクルムーブ
Oracle Move または 100 Pips Momentum は、短期の移動平均に基づくカスタム トレンド フォロー テクニカル インジケーターです。
ほとんどの移動平均線には、XNUMX つの弱点がある傾向があります。 まず、ほとんどの移動平均線は、値動きに比べて遅れる傾向にあります。 インジケーターの信号が遅れていると、トレーダーが適切な取引設定に入り、勝った取引を終了するのが少し遅れてしまうことがよくあります。 これにより、トレーダーが獲得できた可能性のある潜在的な利益が大幅に減少するか、さらに悪いことに、勝つ可能性のある取引が損失に変わります。 XNUMX 番目の弱点は、多くの移動平均線が、むち打ちや不安定な市場状況で発生する誤ったシグナルの影響を受けやすいことです。 これにより、トレーダーは、そもそも取引してはならない取引を開始することになります。
Oracle Move は、両方の弱点を大幅に最小化する XNUMX つの短期移動平均線をプロットするインジケーターです。 このインジケーターがプロットする線は、価格行動の動きに非常に反応し、短期的なモメンタムシフトに適していると同時に、非常に滑らかで、途切れ途切れの市場状況をより適切に処理します.
速い移動平均線は青い線でプロットされ、遅い移動平均線は赤い線でプロットされます。 次に、XNUMX つの移動平均線がどのように重なるかに基づいて、トレンドの方向が識別されます。 青線が赤線より上にある場合は強気トレンド、青線が赤線より下にある場合は弱気トレンドです。 XNUMX つの線の間の交差は、潜在的なトレンドの反転を示している可能性もあります。
相対力指数
相対力指数 (RSI) は、さまざまな用途を持つ古典的なオシレーター タイプのテクニカル インジケーターです。 トレンド、モメンタム、買われ過ぎまたは売られ過ぎの価格条件を特定するために使用できます。
RSI は、0 から 100 の範囲で振動する線をプロットするオシレータです。この線は、過去の価格変動と比較した最近の取引期間の終値に基づいて計算されます。 結果として得られるラインは、スイング ポイントに基づいて価格アクションの動きをいくらか模倣するラインです。
RSI には 30 と 70 のマーカーがあります。これらのマーカーは、買われ過ぎまたは売られ過ぎの価格条件を示します。 70 を超える RSI ラインは買われ過ぎの市場を示し、30 を下回る RSI ラインは売られ過ぎの状態を示します。 逆に、モメンタム トレーダーは、これらのレベルを超える強い違反を、トレンドにつながる可能性のある強いモメンタムの兆候として識別します。
一部のトレーダーは、レベル 45、50、および 55 にマーカーを追加します。レベル 50 はトレンド バイアスを示します。 RSI ラインが通常 50 を超えて維持され、45 でサポートを見つけることは、強気の傾向を示しています。 一方、RSI ラインは一般的に 50 を下回り、55 でレジスタンスを見つけることは弱気トレンドを示しています。
取引戦略
Oracle Move Trend Follow Forex Trading Strategy は、Oracle Move インジケータ、100 期間の指数移動平均 (EMA)、および RSI を使用して、長期トレンドと短期トレンドの間の一致を見つけるトレンド フォロー戦略です。
長期トレンドは、100 EMA ラインの傾き、100 EMA ラインに関連する価格アクションの位置、および価格アクションのトレンド方向に基づいて識別されます。
次に、RSI ラインは、50 マーカーとの関係で一般的にどこに位置するかに基づいて、トレンドを確認し、レベル 45 でサポートを見つけているか、レベル 55 でレジスタンスを見つけているかを確認します。
価格は通常、中央値に戻ります。 これにより、Oracle Move ラインが一時的に反転し、RSI ラインが一時的に 50 付近の領域に戻りますが、レベル 45 または 55 でサポートまたはレジスタンスを見つけることができます。
価格がトレンドを再開すると、Oracle Move ラインがクロスオーバーし、RSI ラインが 55 を超えるか 45 を下回り、トレンドの再開を示します。 この合流点が取引のセットアップになります。
インジケータ:
- 100pips モメンタム
- 100 EMA
- 相対力指数
優先時間枠: 30分足と1時間足のチャート
通貨ペア: FXメジャー、マイナー、クロス
取引セッション: 東京、ロンドン、ニューヨークのセッション
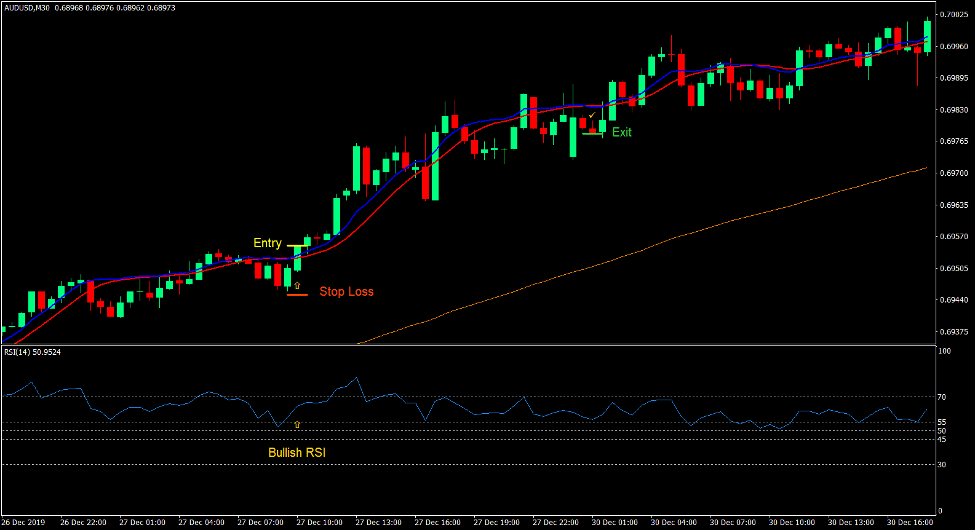
トレードセットアップを購入する
入門
- 価格アクションは、100EMAラインを超える必要があります。
- 価格行動は、その価格変動に基づいて上昇傾向にあるはずです.
- 100EMAラインは傾斜しているはずです。
- RSI ラインは一般的に 50 を超えている必要があります。
- 価格はリトレースして、青色のオラクル ムーブ ラインが一時的にレッド ラインを下回り、RSI ラインが 50 に向かってリトレースし、45 でサポートを見つける必要があります。
- 青色の Oracle Move ラインが赤色のラインより上に交差する必要があります。
- RSIラインは55を超えるはずです。
- これらの条件を確認して、購入注文を入力します。
ストップロス
- エントリーキャンドルの下のサポートでストップロスを設定します。
出口
- Oracle Moveインジケーターの青い線が赤い線を下回ったらすぐに取引を終了します.

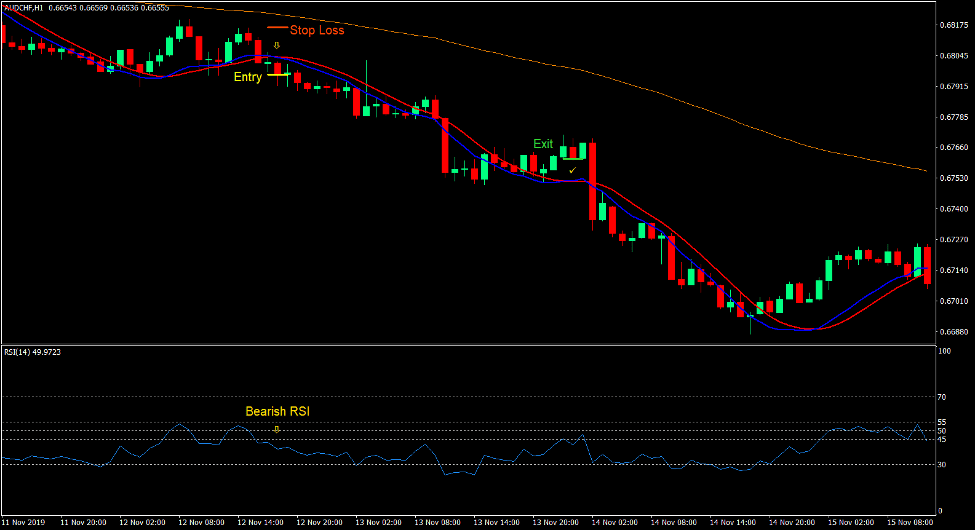
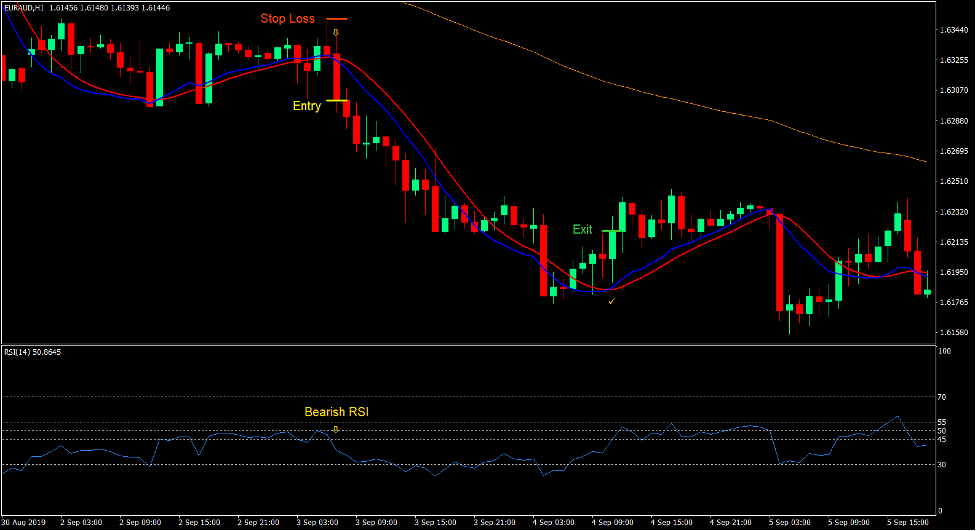
トレードセットアップを売る
入門
- 価格アクションは、100EMAラインを下回る必要があります。
- 価格行動は、その価格変動に基づいて下降傾向にあるはずです.
- 100EMAラインは傾斜しているはずです。
- RSI ラインは一般的に 50 を下回るはずです。
- 価格がリトレースして、青色のオラクル ムーブ ラインが一時的にレッド ラインを上回り、RSI ラインが 50 に向かってリトレースし、55 でレジスタンスを見つける必要があります。
- 青の Oracle Move ラインが赤のラインより下に交差する必要があります。
- RSIラインは45を下回るはずです。
- これらの条件を確認して、販売注文を入力します。
ストップロス
- ストップロスをエントリーキャンドルの上の抵抗に設定します。
出口
- Oracle Moveインジケーターの青い線が赤い線を超えたらすぐに取引を終了します.
まとめ
この取引戦略は、Oracle Move インジケーターの応答性の高い短期シグナルを利用する基本的なトレンドフォローまたはトレンド再エントリー戦略です。
オラクル ムーブ インジケーター自体は完璧ではありませんが、トレンドにつながる可能性のある高確率のトレンド反転シグナルを提供します。
100 EMA ラインと RSI ラインのトレンド表示の組み合わせは、一般的なトレンドの方向性を単純に確認するものであり、トレードのセットアップに続いて高い確率でトレンドが発生するはずです。
おすすめのMT4ブローカー
XMブローカー
- 無料$ 50 すぐに取引を開始するには! (出金可能利益)
- までのデポジットボーナス $5,000
- 無制限のロイヤルティプログラム
- 受賞歴のある外国為替ブローカー
- 追加の独占ボーナス 年間を通じて

>> ここからXMブローカーアカウントにサインアップしてください<
FBSブローカー
- トレード100ボーナス: 100 ドルを無料で取引の旅を始めましょう!
- 100%の入金ボーナス: 入金額を最大 $10,000 まで XNUMX 倍にし、強化された資本で取引します。
- 1まで活用する:3000: 利用可能な最高のレバレッジ オプションの 1 つで潜在的な利益を最大化します。
- 「アジアのベストカスタマーサービスブローカー」賞: カスタマーサポートとサービスの優秀性が認められています。
- 季節のプロモーション: 一年中、さまざまな限定ボーナスやプロモーション特典をお楽しみいただけます。

>> ここからFBSブローカーアカウントにサインアップしてください<
ダウンロードするには、以下をクリックしてください。