


モメンタム ブレイクアウトは、価格が一方向に強く動くタイプの市況で、通常は数本のろうそくの範囲内で、時には XNUMX つの価格ろうそくから始まることさえあります。 これらのローソク足は、通常、小さな価格で優柔不断な価格ローソク足によって特徴付けられる市場収縮フェーズのブレイクアウトであることがよくあります。 長いフルボディのろうそくの突然の出現は、トレーダーがすぐに売買する原因となった市場イベントが発生したことを示しています.
モメンタムブレイクアウトには、非常に多くの可能性があります。 これは、モメンタムのブレイクアウトが新しいトレンドの始まりであることが多いためです。 これらの新鮮なトレンドをキャッチし、最後までそれを乗り切ることができるトレーダーは、XNUMX 回の取引で莫大な利回りを得ることができます。
ただし、モメンタム トレーダーは、市場が特定の方向に動くと、価格を追跡する傾向もあります。 モメンタムトレーダーは、新しいトレンドをもたらす可能性のある適切なモメンタムブレイクアウトシグナルを客観的に特定できる体系的なモメンタムトレーディング戦略を必要としています.
ボリンジャーバンド
ボリンジャー バンドは、最も汎用性の高いテクニカル指標の XNUMX つです。 これはトレンド フォロー テクニカル インジケーターであり、トレーダーにボラティリティに関する情報を提供し、平均反転やモメンタム ブレイクアウトを特定するためにも使用できます。
ボリンジャー バンド インジケーターは XNUMX 本の線で構成されています。
中央の線は 20 期間の単純移動平均 (SMA) 線です。 そのため、トレーダーはそれをトレンド指標として使用できます。 トレンドの方向は、中央の線の傾きと、線に対する価格行動の一般的な位置に基づいて識別できます。 トレンド反転シグナルは、価格アクションと中間線の交差に基づいて識別することもできます.
外側の XNUMX つの線は、基本的に中央の線からの標準偏差です。 これらの線は、通常、中央の線の上下にシフトした XNUMX つの標準偏差に設定されます。
外側の線は標準偏差に基づいているため、ボリンジャー バンドを使用してボラティリティを特定できます。 バンドの拡大は市場の拡大フェーズを示し、バンドの縮小は市場の縮小フェーズを示します。
平均反転トレーダーは、ボリンジャー バンドを使用して、買われ過ぎまたは売られ過ぎの価格条件からの平均反転の可能性を特定します。 外側の線の外側の領域は、売られすぎおよび買われすぎの領域と見なされます。 線の外側で価格拒否の兆候を示すろうそくの価格は、価格が買われ過ぎまたは売られ過ぎであり、すぐに逆転する可能性があることを示している可能性があります。
一方、モメンタム トレーダーは、モメンタム ブレイクアウトの基礎として外側のラインを使用します。 ボリンジャー バンドの外で強いモメンタム ローソク足がブレイクした場合、市場の収縮期からのモメンタム ブレイクアウトと解釈できます。
指数移動平均シグナル
トレーダーが潜在的なトレンド反転を特定する最も一般的な方法の XNUMX つは、移動平均線のクロスオーバーに基づいています。 適切なパラメータを使用し、適切な市況で使用すると、移動平均クロスオーバー シグナルは非常に効果的になります。
指数移動平均シグナルは、この概念に基づいています。 基礎となる移動平均線が交差することを検出するたびに、矢印をプロットします。 矢印が指している方向は、トレンドの方向を示しています。
このインジケーターは指数移動平均 (EMA) を使用します。このタイプの移動平均線は、価格の動きに非常に反応する傾向があり、トレンド反転シグナルに最適です。
コッポックインジケーター
Coppock インジケーターは、トレーダーがトレンドの方向性を特定するのに役立つカスタム テクニカル インジケーターです。 これは、トレンドの方向を示すためにヒストグラム バーをプロットするオシレーター タイプのインジケーターです。
この指標は、中央値ゼロを中心に振動するヒストグラム バーをプロットします。 正のバーは強気トレンド バイアスを示し、負のバーは弱気トレンド バイアスを示します。
そのパラメーターはトレーダーの取引スタイルに合わせて変更できますが、当然、長期的なトレンドを示すのに適しています。
トレーダーは、バーのシフトを正または負に使用して、トレンドの反転の可能性を示すことができます.
トレーダーは、トレンド方向フィルターとしてインジケーターを使用して、トレンドの方向に反する取引を避けることもできます.
取引戦略
Coppock Momentum Trend Forex Trading Strategyは、勢いのブレイクアウトシナリオによって開始されるトレンドフォロー戦略です。
ボリンジャー バンド インジケーターは、モメンタム ブレイクアウトを識別するために使用されます。 強いモメンタム キャンドルがボリンジャー バンドから抜け出して、モメンタム ブレイクアウトを示すはずです。 価格アクションは、ブレイクアウトが発生したボリンジャー バンドの半分にとどまる必要があります。これは、ダイナミック サポートまたはレジスタンスとして中央線を尊重していることを示しています。
指数移動平均シグナルは、予想されるトレンド反転の方向を示す矢印もプロットする必要があります。
次に、Coppock バーがゼロを超えてシフトし、トレンドがトレンドの方向にシフトしたことを示します。
インジケータ:
- ボリンジャー バンド (デフォルト設定)
- 指数移動平均シグナル
- より高速なEMA:25
- 遅いEMA:30
- コポック
- Rピリオド1:36
優先時間枠: 30分、1時間、4時間のチャート
通貨ペア: FXメジャー、マイナー、クロス
取引セッション: 東京、ロンドン、ニューヨークのセッション
トレードセットアップを購入する
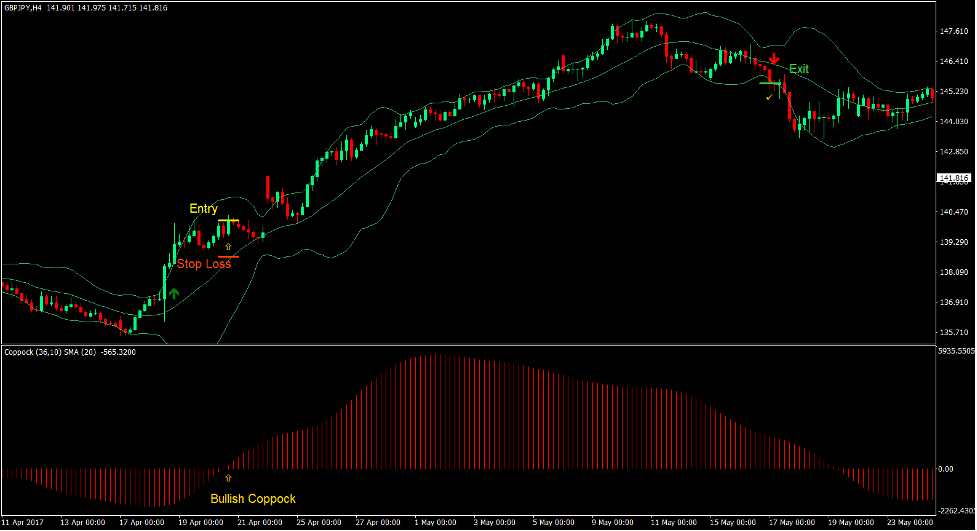
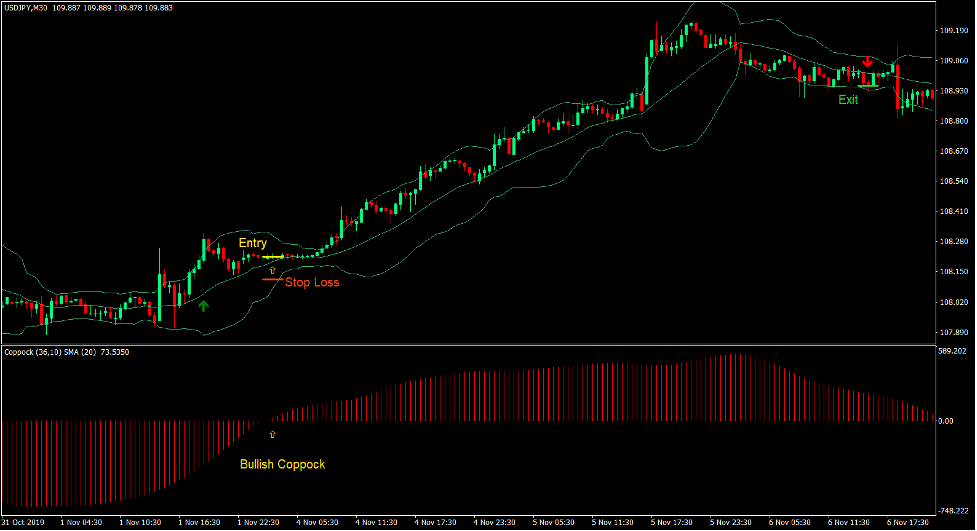
入門
- 強気の勢いのろうそくは、ボリンジャー バンドの上部の線を超える必要があります。
- 指数移動平均シグナルインジケーターは、上向きの矢印をプロットする必要があります.
- Coppock バーはゼロより上に移動する必要があります。
- これらの条件を確認して、購入注文を入力します。
ストップロス
- エントリーキャンドルの下のサポートにストップロスを設定します.
出口
- ローソク足がボリンジャー バンドの下線を下回ったらすぐに取引を終了します。
- 指数移動平均シグナルインジケーターが下向きの矢印をプロットしたらすぐに取引を終了します.
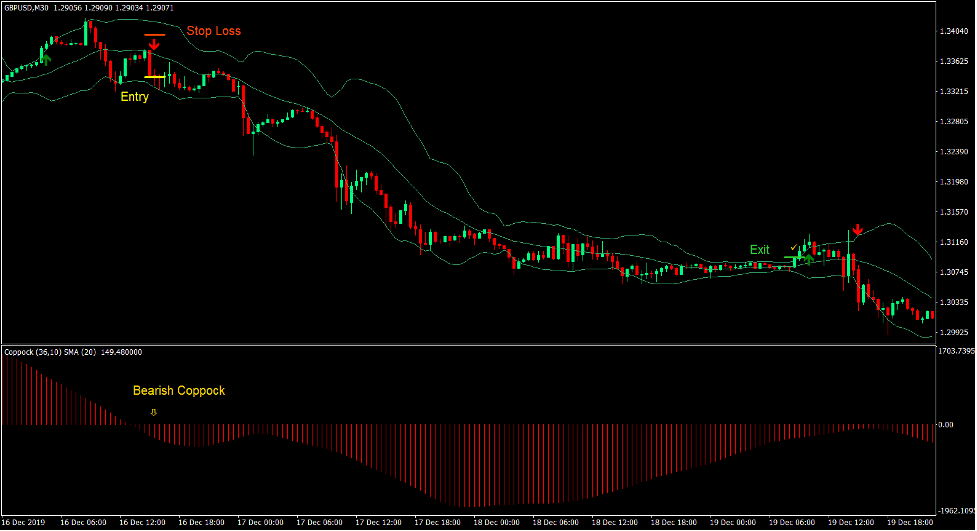
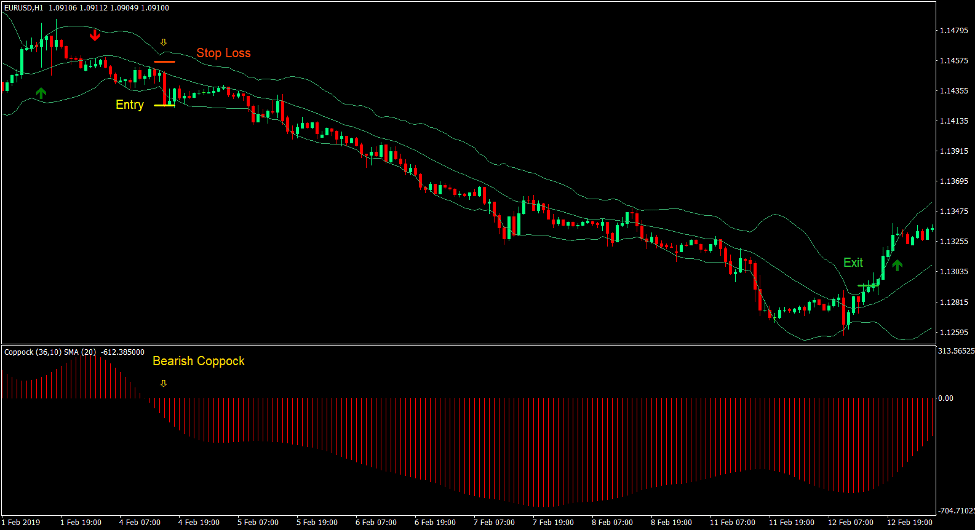
トレードセットアップを売る
入門
- 弱気のモメンタム キャンドルは、ボリンジャー バンドの下線を下回ります。
- 指数移動平均シグナルインジケーターは、下向きの矢印をプロットする必要があります.
- Coppock バーはゼロ以下にシフトする必要があります。
- これらの条件を確認して、販売注文を入力します。
ストップロス
- エントリーキャンドルの上のレジスタンスにストップロスを設定します.
出口
- ローソク足がボリンジャー バンドの上限線の上で閉じたらすぐに取引を閉じます。
- 指数移動平均シグナルインジケーターが下向きの矢印をプロットしたらすぐに取引を終了します.
まとめ
この取引戦略は、高利回りの取引を生み出す可能性のある取引設定を生み出す可能性があります。 これは、モメンタムのブレイクアウトがトレンド市場の状態になることが多いためです。
ただし、ブレイクアウトキャンドル自体は、トレンドの反転が差し迫っていることを意味するものではありません. 満たさなければならない多くの条件があります。 それは、価格行動のスイングの方向へのシフトと、動的サポートまたはレジスタンスの再テストである可能性があります.
この取引戦略は、一連のルールに基づいてトレンドの反転を体系的に確認します。これにより、トレーダーは自分自身を推測することなく自動的に取引を開始できます。
おすすめのMT4ブローカー
XMブローカー
- 無料$ 50 すぐに取引を開始するには! (出金可能利益)
- までのデポジットボーナス $5,000
- 無制限のロイヤルティプログラム
- 受賞歴のある外国為替ブローカー
- 追加の独占ボーナス 年間を通じて

>> ここからXMブローカーアカウントにサインアップしてください<
FBSブローカー
- トレード100ボーナス: 100 ドルを無料で取引の旅を始めましょう!
- 100%の入金ボーナス: 入金額を最大 $10,000 まで XNUMX 倍にし、強化された資本で取引します。
- 1まで活用する:3000: 利用可能な最高のレバレッジ オプションの 1 つで潜在的な利益を最大化します。
- 「アジアのベストカスタマーサービスブローカー」賞: カスタマーサポートとサービスの優秀性が認められています。
- 季節のプロモーション: 一年中、さまざまな限定ボーナスやプロモーション特典をお楽しみいただけます。

>> ここからFBSブローカーアカウントにサインアップしてください<
ダウンロードするには、以下をクリックしてください。