


Le strategie che seguono la tendenza sono probabilmente uno dei tipi di strategie più facili da implementare. È basato su regole, facile da capire e, con il giusto tipo di mercato, potrebbe funzionare bene per molti trader.
Esistono molti tipi diversi di strategie che seguono la tendenza. Esistono strategie di crossover della media mobile, alcune utilizzerebbero l'azione dei prezzi dei grafici nudi e alcune linee di tendenza, mentre altre utilizzerebbero indicatori tecnici.
Tra quelli menzionati, l'uso degli indicatori tecnici è probabilmente uno dei modi più semplici per seguire il trend. Questo perché gli indicatori tecnici rendono facile per i trader seguire le regole ed eliminano gran parte del lavoro di congettura dal processo.
La strategia di trading Forex MACD Fx Line è una strategia di trend tracking personalizzata basata su indicatori tecnici. Ciò consente ai trader di seguire e implementare una strategia di trading che funzioni bene sui mercati forex.
Convergenza e divergenza nella media mobile
La media mobile di convergenza e divergenza o MACD è un indicatore tecnico ampiamente utilizzato. Nonostante la sua semplicità, molti trader professionisti che lo hanno utilizzato hanno guadagnato denaro utilizzando strategie basate sul MACD e analisi tecnica.
Il MACD è un indicatore oscillante basato su tre medie mobili. Le prime due medie mobili sono medie mobili esponenziali (EMA) e una EMA è più veloce dell'altra. L'EMA più lento viene quindi sottratto dall'EMA più veloce. La differenza tra i due viene quindi tracciata sul grafico del MACD, solitamente come istogramma. Quindi, un'altra media mobile viene utilizzata come linea di segnale. Di solito si tratta di una media mobile semplice (SMA).
Esistono molti modi per negoziare il MACD. Un modo è utilizzare l'incrocio della linea del segnale o dell'istogramma sulla linea mediana. Se si utilizzasse l'istogramma incrociato sulla linea mediana, tecnicamente la strategia sarebbe comunque una strategia crossover poiché si basa sulla differenza di due medie mobili.
Un altro modo per negoziarlo è negoziare l'incrocio tra l'istogramma e la linea del segnale. I segnali di acquisto vengono generati quando gli istogrammi attraversano la linea del segnale e i segnali di vendita se è il contrario.
La linea mediana potrebbe anche essere utilizzata come filtro commerciale. Questo perché il prezzo in genere torna alla media, anche il MACD di solito torna alla linea mediana. Questo è popolare tra i trader con reversione media.
Poi c’è chi usa il MACD come base per le divergenze. Questi sono i disaccordi tra i massimi e i minimi di un indicatore oscillante e l’azione dei prezzi.
Indicatore della linea FX
L'indicatore della linea Fx è un indicatore personalizzato basato su una media mobile modificata. Questo indicatore tecnico disegna una linea della media mobile sul grafico dei prezzi, che cambia colore ogni volta che la linea cambia direzione della pendenza. Se la linea è inclinata verso l'alto, è dipinta di blu. Se la linea è in pendenza, è dipinta di bianco.
Ciò si basa sull'idea che uno dei modi per determinare la direzione del trend utilizzando una linea della media mobile si basa sulla direzione della sua pendenza. Le medie mobili sono considerate rialziste quando sono in rialzo e ribassiste quando sono in calo. Quanto più ripida è la pendenza, tanto più forte è la tendenza. D’altro canto, i pendii più pianeggianti sono comuni nei mercati instabili.
Concetto di strategia commerciale
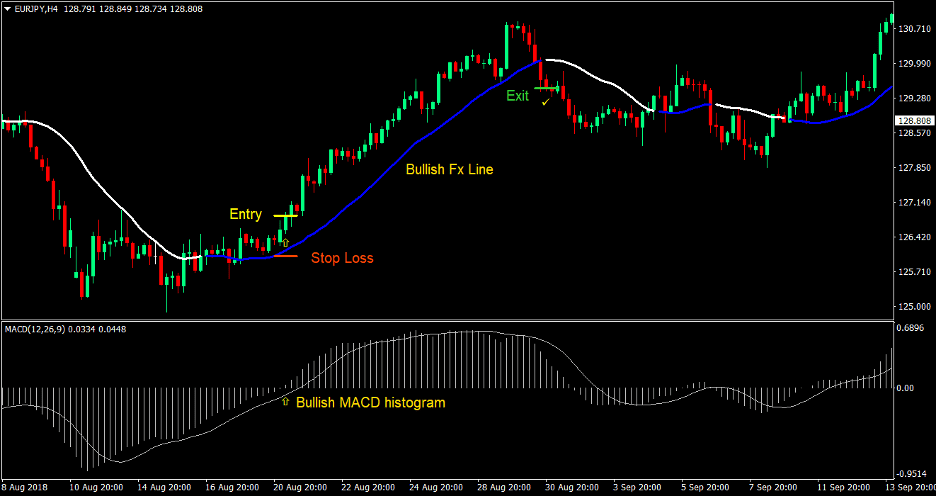
La strategia di trading Forex MACD Fx Line produce segnali di trading basati sulla convergenza del crossover dell'istogramma MACD della linea mediana e della direzione della pendenza della linea Fx.
Individualmente, questi indicatori tecnici, sebbene non perfetti, potrebbero produrre operazioni che si traducono in configurazioni commerciali ad alto rendimento. Se combinate insieme, le configurazioni tendono ad avere un tasso di vincita migliore, migliorando ulteriormente i rendimenti delle operazioni redditizie. Questo perché le operazioni vengono chiuse prima che il mercato si inverta completamente. Ciò impedisce ai trader di cedere gran parte del profitto al mercato.
Indicatori:
- ForexLine_update_03
- MACD
Lasso di tempo: Grafici di 1 ora, 4 ore e giornalieri
Coppia di valute: coppie maggiori e minori
Sessione di trading: Sessioni di Tokyo, Londra e New York
Acquista la configurazione commerciale (lunga).
Iscrizione
- L'indicatore della linea Fx dovrebbe dipingere una media mobile blu che indica una tendenza del mercato rialzista
- Inserisci un ordine di acquisto non appena l'istogramma MACD supera la linea mediana indicando un segnale rialzista
Stop Loss
- Imposta lo stop loss al livello di supporto sotto la candela di entrata
uscita
- Chiudi l'operazione non appena l'indicatore della linea Fx diventa bianco, indicando una probabile inversione di tendenza ribassista
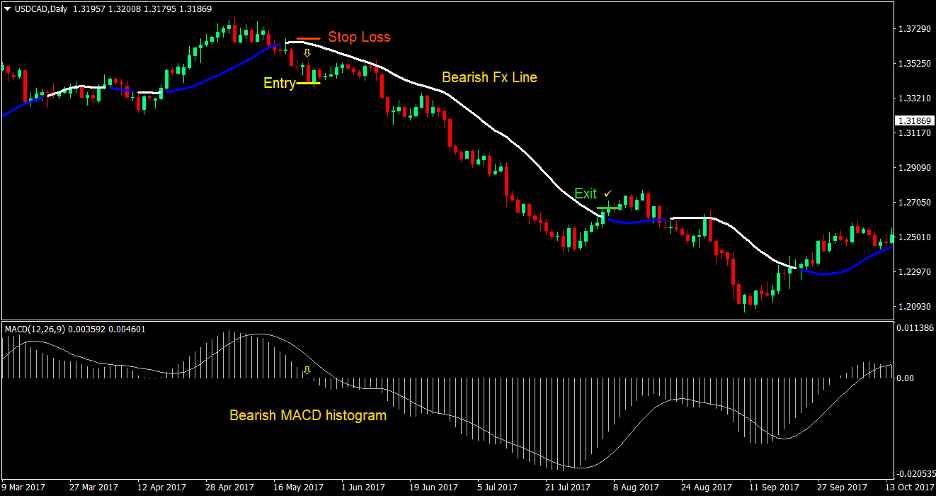
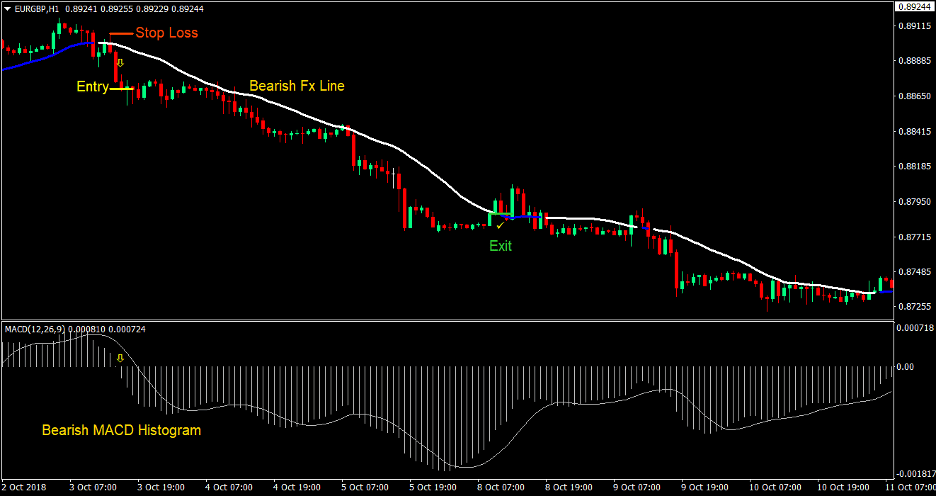
Vendere (breve) Impostazione commerciale
Iscrizione
- L'indicatore della linea Fx dovrebbe dipingere una media mobile bianca che indica una propensione al ribasso del mercato
- Inserisci un ordine di vendita non appena l'istogramma MACD attraversa la linea mediana indicando un segnale ribassista
Stop Loss
- Imposta lo stop loss al livello di resistenza sopra la candela di entrata
uscita
- Chiudi l'operazione non appena l'indicatore della linea Fx diventa blu, indicando una probabile inversione di tendenza rialzista
Conclusione
La strategia di trading Forex MACD Fx Line è un'eccellente strategia che segue la tendenza, che consente ai trader di identificare oggettivamente i punti di ingresso in base alla direzione della tendenza dei mercati. Questa strategia di trading di solito si traduce in configurazioni di trading ad alto rendimento, che potrebbero trarre profitto dai rendimenti con un rischio di 3:1 o più.
Ci sono casi, tuttavia, in cui il mercato non segue un trend abbastanza lungo e si inverte troppo presto. Questo è comune in condizioni di mercato instabili e limitate. Evitare di utilizzare questa strategia in tali condizioni. Implementa invece questa strategia su mercati e coppie che hanno una forte tendenza al trend.
Broker MT4 consigliati
XM Broker
- Free $ 50 Per iniziare a fare trading all'istante! (Profitto prelevabile)
- Bonus di deposito fino a $5,000
- Programma fedeltà illimitato
- Broker Forex pluripremiato
- Bonus esclusivi aggiuntivi Durante tutto l'anno

>> Registrati per un conto broker XM qui <
Broker FBS
- Scambia 100 bonus: $ 100 gratuiti per iniziare il tuo viaggio nel trading!
- 100% Bonus: Raddoppia il tuo deposito fino a $ 10,000 e fai trading con un capitale maggiore.
- Utilizza fino a 1: 3000: Massimizzare i profitti potenziali con una delle opzioni di leva finanziaria più elevate disponibili.
- Premio "Miglior broker di assistenza clienti in Asia".: Eccellenza riconosciuta nell'assistenza e nel servizio clienti.
- Promozioni stagionali: Approfitta di una varietà di bonus esclusivi e offerte promozionali tutto l'anno.

>> Registrati per un conto broker FBS qui <
Clicca qui sotto per scaricare: