


Trader diversi hanno approcci diversi quando si tratta di fare trading sul mercato Forex. Molti considerano il trading sul Forex come una scienza fissa. Cercherebbero scenari ricorrenti nel mercato forex, identificherebbero le confluenze comuni tra questi scenari sulla base di indicatori tecnici, raccoglierebbero dati e identificherebbero se la configurazione commerciale che hanno identificato è una configurazione commerciale ad alta probabilità o meno. Quindi, scambierebbero queste configurazioni se la probabilità è abbastanza buona.
D'altra parte, alcuni trader si avvicinano al trading sul mercato Forex come a un'arte. Invece di utilizzare dati oggettivi fissi come base per una configurazione commerciale, cercherebbero modelli ricorrenti su cui basare il proprio commercio. Alcuni scambierebbero su modelli di prezzo o modelli a candela, mentre altri scambierebbero in base al supporto e alle resistenze del flusso di mercato. Sebbene queste configurazioni possano essere identificate soggettivamente, potrebbero funzionare molto bene per il trader giusto.
Uno dei modelli ricorrenti più popolari nel mercato del trading è il ritorno dei prezzi verso i rapporti di Fibonacci prima di spingere verso un altro breakout. Sebbene non esista alcuna base scientifica o logica sul motivo per cui il prezzo agisce in questo modo, sembra che funzioni molto bene per molti trader.
Rapporti di Fibonacci
I rapporti di Fibonaci sono una serie di numeri che rappresentano un rapporto di natura ricorrente. Questo rapporto e proporzione si trovano nell'elica di una conchiglia, nelle vene di una foglia, nei frattali di un fiocco di neve, negli arti di un corpo umano e altro ancora. Si dice anche che sia il rapporto standard più attraente per molte persone.
Questo rapporto si verifica anche nei pullback dell'azione dei prezzi in un grafico dei prezzi. Sebbene non vi sia alcuna base scientifica sul motivo per cui ciò accade, il prezzo tende a rimbalzare in corrispondenza dei ritracciamenti che sono significativi rapporti di Fibonacci. Tra questi rapporti, il più popolare è la sezione aurea, che equivale a 1.618. Si osserva che il prezzo rimbalza a livelli intorno al 61.8% dell'oscillazione del prezzo. E potrebbe spesso spingersi ulteriormente al 161.8% dell’oscillazione dei prezzi precedente.
Gli strumenti di creazione di grafici tecnici disponibili nella maggior parte delle piattaforme di trading, inclusa MT4, includono il righello del ritracciamento di Fibonacci. Questo strumento è ampiamente utilizzato da molti trader per identificare tali punti di pullback.
Pin Bar
La Pin Bar è uno schema a candela ricorrente molto popolare tra molti trader di price action. Rappresenta un'inversione improvvisa che si verifica all'interno di una barra del candeliere. Questa improvvisa inversione forma una candela con un corpo molto piccolo da un lato e un lungo stoppino o coda dall'altro.
Questo modello a candela indica un'indicazione di inversione molto forte. In effetti, molti trader lo utilizzano come trigger di ingresso. Utilizzerebbero questi modelli come base per una configurazione commerciale.
L'indicatore Pin Bar è un indicatore tecnico personalizzato che aiuta i trader a identificare facilmente tali modelli. Traccia una freccia che punta verso l'alto ogni volta che rileva una pin bar rialzista e una freccia che punta verso il basso ogni volta che rileva una pin bar ribassista.
Uscita lampadario
L'indicatore Chandelier Exit è un trend personalizzato che segue un indicatore tecnico basato sull'Average True Range (ATR).
Questo indicatore identifica la direzione del trend prevalente. Quindi traccia una linea che segue l'azione dei prezzi di un multiplo dell'ATR. Il trend è rialzista se la linea scende al di sotto dell’azione dei prezzi. D’altro canto, il trend è ribassista se la linea supera l’azione dei prezzi. Anche il colore della linea cambia a seconda della direzione del trend. Una linea arancione indica un trend rialzista, mentre una linea magenta indica un trend ribassista.
Questo indicatore può essere utilizzato come indicatore di inversione di tendenza basato sullo spostamento della linea di uscita del lampadario, un trailing stop loss in cui i trader possono posizionare il proprio stop loss dietro la linea e un filtro di polarizzazione della direzione del trend in cui i trader scambierebbero solo nella direzione di il trend indicato dalla linea di Uscita del Lampadario.
Trading Strategia
La strategia di trading Forex con pullback del rapporto aureo è una strategia di pullback del ritracciamento di Fibonacci che viene negoziata in base a pullback e rifiuti di prezzo che si verificano nell'area compresa tra il 50% e il 61.8% del rapporto di Fibonacci.
Innanzitutto, dovremmo identificare i punti di oscillazione e collegare un righello di ritracciamento di Fibonacci tra i punti di oscillazione.
Quindi, dovremmo confermare se la tendenza al trend indicata dalla linea di uscita del lampadario concorda con la direzione del nostro commercio.
Quindi, aspettiamo che si formi un pattern a pin bar nell'area compresa tra il 50% e il 61.8% del righello del ritracciamento di Fibonacci. L'indicatore della barra pin ci renderebbe più semplice identificare questi modelli poiché dovrebbe tracciare una freccia che punta nella direzione del modello della barra pin.
Quindi entriamo nell'operazione con i nostri obiettivi nel precedente punto di oscillazione opposto.
Indicatori:
- Pinbar
- Lampadario Esci
Intervalli di tempo preferiti: Grafici di 1 ora e 4 ore
Coppie di valute: FX major, minors e cross
Sessioni di trading: Sessioni di Tokyo, Londra e New York
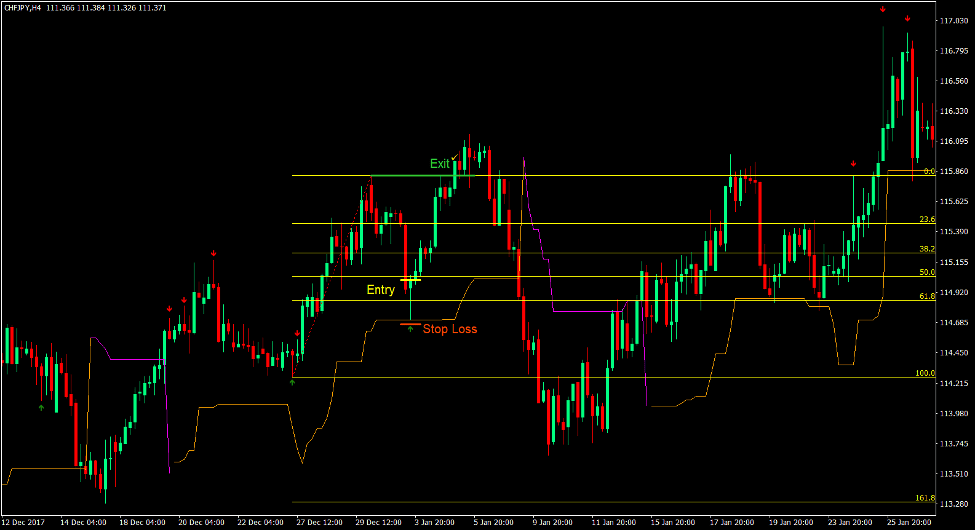
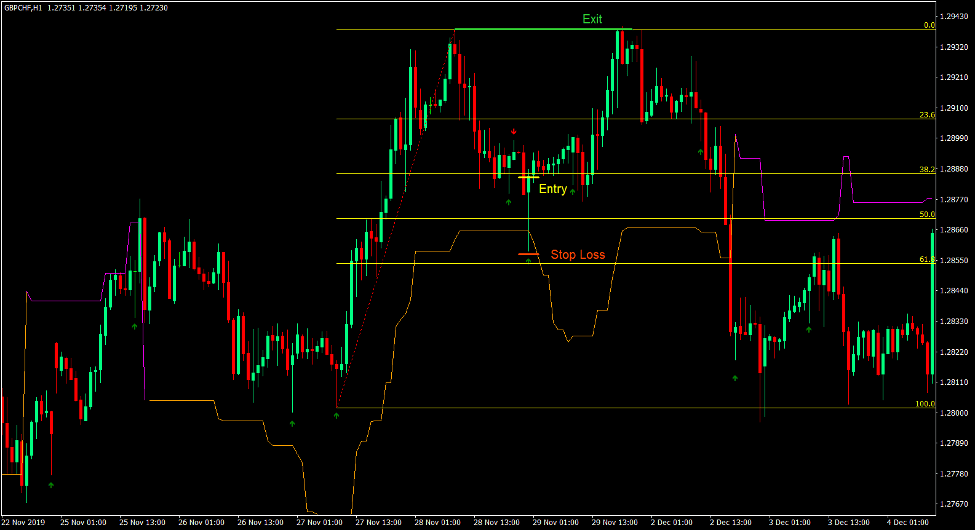
Acquista Trade Setup
Iscrizione
- Collega il righello del ritracciamento di Fibonacci dallo swing basso allo swing alto.
- L'azione dei prezzi dovrebbe essere al di sopra della linea di uscita del lampadario.
- Il prezzo dovrebbe ritirarsi verso l'area compresa tra il 50% e il 61.8% del righello del ritracciamento di Fibonacci e respingere detta area.
- L'indicatore Pin Bar dovrebbe tracciare una freccia rivolta verso l'alto.
- Inserisci un ordine di acquisto alla conferma di queste condizioni.
Stop Loss
- Imposta lo stop loss al supporto sotto la candela di ingresso.
uscita
- Imposta l'obiettivo del take profit al massimo dello swing precedente.
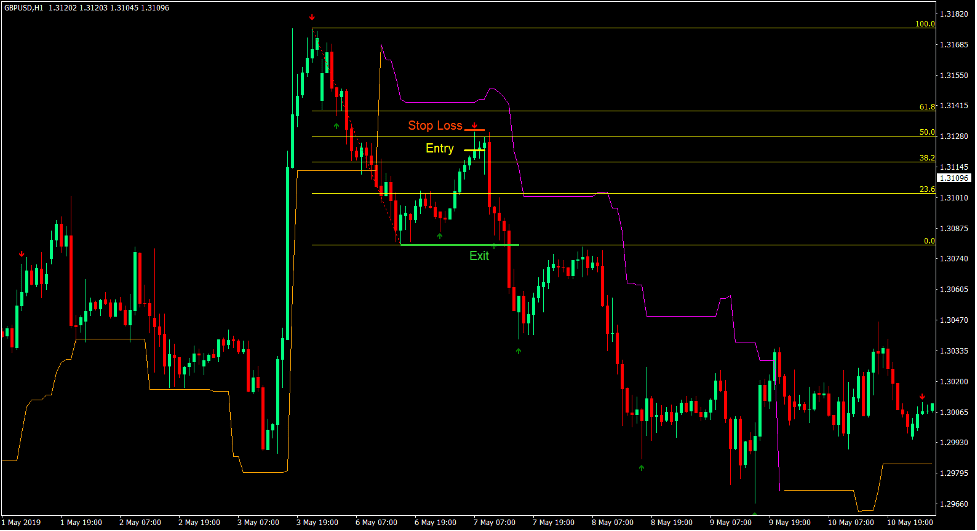
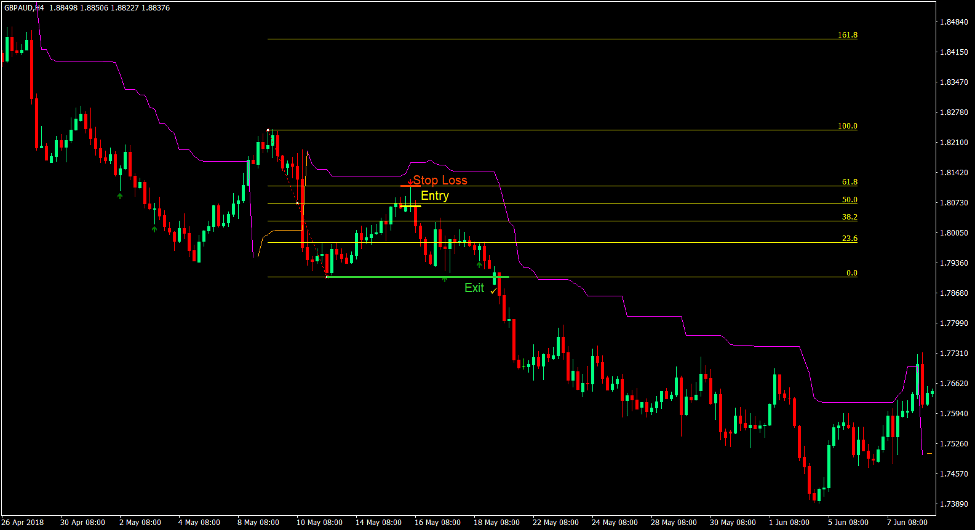
Vendi configurazione commerciale
Iscrizione
- Collega il righello del ritracciamento di Fibonacci dallo swing alto a quello basso.
- L'azione dei prezzi dovrebbe essere al di sotto della linea di uscita del lampadario.
- Il prezzo dovrebbe ritirarsi verso l'area compresa tra il 50% e il 61.8% del righello del ritracciamento di Fibonacci e respingere detta area.
- L'indicatore Pin Bar dovrebbe tracciare una freccia rivolta verso il basso.
- Inserisci un ordine di vendita sulla conferma di queste condizioni.
Stop Loss
- Imposta lo stop loss alla resistenza sopra la candela di ingresso.
uscita
- Imposta l'obiettivo del take profit al minimo dello swing precedente.
Conclusione
Il trading basato sui pullback del ritracciamento di Fibonacci è una strategia di trading ampiamente utilizzata. Molti trader professionisti operano secondo questo tipo di configurazione. Alcuni scambierebbero esclusivamente in base al rifiuto dell'azione dei prezzi al 61.8%, mentre altri scambierebbero ai livelli del 50% e 38.2%. Più profondo è il ritracciamento, migliore è il rapporto rischio-rendimento. Alcuni trader sarebbero conservatori e punterebbero solo al punto di oscillazione precedente, mentre altri punterebbero al livello del 161.8%. I trader possono adeguarsi in base alla loro propensione al rischio utilizzando questo tipo di strategia.
L'inclusione dell'indicatore Chandelier Exit consente ai trader di filtrare le operazioni in base alla tendenza. Ciò consente ai trader di avere una migliore probabilità di vincita.
Sebbene queste configurazioni commerciali non siano facili da trovare, tendono ad essere molto efficaci e vengono utilizzate da molti trader professionisti in tutto il mondo.
Broker MT4 consigliati
XM Broker
- Free $ 50 Per iniziare a fare trading all'istante! (Profitto prelevabile)
- Bonus di deposito fino a $5,000
- Programma fedeltà illimitato
- Broker Forex pluripremiato
- Bonus esclusivi aggiuntivi Durante tutto l'anno

>> Registrati per un conto broker XM qui <
Broker FBS
- Scambia 100 bonus: $ 100 gratuiti per iniziare il tuo viaggio nel trading!
- 100% Bonus: Raddoppia il tuo deposito fino a $ 10,000 e fai trading con un capitale maggiore.
- Utilizza fino a 1: 3000: Massimizzare i profitti potenziali con una delle opzioni di leva finanziaria più elevate disponibili.
- Premio "Miglior broker di assistenza clienti in Asia".: Eccellenza riconosciuta nell'assistenza e nel servizio clienti.
- Promozioni stagionali: Approfitta di una varietà di bonus esclusivi e offerte promozionali tutto l'anno.

>> Registrati per un conto broker FBS qui <
Clicca qui sotto per scaricare: