


Il settore immobiliare è uno dei settori migliori quando si tratta di produrre milionari. Inoltre, in cima alla lista ci sono la finanza e gli investimenti. È qui che il trading sul Forex, così come il trading di altri tipi di asset e mercati, falsificano. Cosa hanno in comune questi due tipi di industrie che sono in grado di produrre così tanti soldi velocemente?
La risposta è che consente agli individui intraprendenti di fare una rapida svolta per far crescere le proprie risorse. Allora, come fanno gli investitori immobiliari a guadagnare vendendo le proprietà? In primo luogo, hanno un'idea di come si sta muovendo il mercato immobiliare in una zona. Cercherebbero di scoprire la fascia di prezzo in cui vengono vendute le proprietà in una zona. Quindi, avrebbero aspettato che si presentassero opportunità di acquisto. Non comprerebbero ogni proprietà disponibile che viene loro presentata. Invece, aspetterebbero una proprietà che potrebbero considerare come uno sconto. Può darsi che i proprietari siano pieni di debiti e siano desiderosi di vendere la loro proprietà. Potrebbe anche darsi che la proprietà sia stata pignorata e messa all'asta a basso prezzo. Se il prezzo fosse giusto, si tufferebbero per acquistare la proprietà. Quindi, lo sistemerebbero un po' e aspetterebbero che l'acquirente giusto glielo togliesse di mano a un prezzo che si trova nella fascia superiore dell'attuale prezzo di mercato.
Poiché lo stesso concetto di flipping esiste anche nel trading Forex, potremmo fare esattamente la stessa cosa. Innanzitutto, capiamo se il mercato è rialzista o meno. Quindi, aspettiamo che il prezzo venga nuovamente testato o torni a un livello che potremmo considerare economico. Utilizzando regole commerciali logiche, acquistiamo quindi ogni volta che il prezzo è scontato. Quindi, aspettiamo che il prezzo si riprenda per ottenere un profitto. L’aspetto positivo del trading sul Forex è che potremmo fare la stessa cosa in un mercato ribassista. L'unica differenza è che mettiamo short sul mercato ogni volta che il prezzo ritorna al rialzo.
La strategia di trading Forex a nastro con media mobile dinamica è costruita attorno a questo concetto di effettuare operazioni ogni volta che il prezzo ritesta o ripercorre un'area dinamica di supporto o resistenza utilizzando le medie mobili.
Nastro MA pieno 89.21
MA Ribbon Filled 89.21 è un indicatore di tendenza basato sulle medie mobili. È un semplice indicatore che traccia due linee di media mobile, che sono la media mobile esponenziale (EMA) a 21 periodi e la media mobile esponenziale (EMA) a 89 periodi. La linea 21 EMA è colorata di lime, mentre la linea 89 EMA è rossa.
Questo indicatore viene utilizzato principalmente per identificare trend e inversioni di tendenza utilizzando l'incrocio delle due linee della media mobile. Se la linea EMA 21 supera la linea EMA 89, l'indicatore riempirà l'area tra le due linee con barre di calce. Ciò indicherebbe che il trend è rialzista. D'altra parte, se la linea EMA 21 è al di sotto della linea EMA 89, l'area tra le linee sarà piena di barre rosse che indicano una tendenza ribassista.
Convergenza e divergenza nella media mobile
Il MACD o Moving Average Convergence and Divergence è un indicatore tecnico ampiamente utilizzato. È un oscillatore che viene utilizzato per identificare trend e possibili inversioni di trend.
Il MACD è fondamentalmente un calcolo della differenza di due linee di media mobile, in particolare la media mobile esponenziale a 12 periodi e la media mobile esponenziale a 26 periodi. La differenza tra le due linee EMA viene quindi tracciata come linea MACD. In questa versione, viene tracciato come una barra dell'istogramma.
Quindi, dalle barre MACD viene derivata una media mobile semplice (SMA) a 9 barre. Questa viene quindi tracciata come una linea di segnale.
Le barre positive indicano un trend rialzista, mentre le barre negative indicano un trend ribassista.
Gli incroci tra le barre MACD e la linea del segnale indicano potenziali inversioni di tendenza.
Trading Strategia
Questa strategia di trading utilizza l'indicatore MA Ribbon Filled 89.21 come area di supporto o resistenza dinamico. Viene scambiato sui rimbalzi dall'area dopo un ritracciamento.
Innanzitutto dobbiamo identificare la tendenza. Questo si basa sulle linee della media mobile sul MA Ribbon Filled 89.21 e su una media mobile esponenziale (EMA) di 200 periodi. La tendenza si basa su come sono impilate le tre linee, nonché sulla pendenza delle linee.
Quindi, aspettiamo che il prezzo ritraccia, il che dovrebbe causare una temporanea inversione del MACD.
Il segnale di ingresso si basa quindi sull'incrocio delle barre MACD e della linea del segnale. Le operazioni vengono inoltre filtrate in base al fatto che le barre siano positive o negative.
Indicatori:
- MA nastro riempito.89.21
- 200 EMA
- MACD
Intervalli di tempo preferiti: Grafici a 30 minuti, 1 ora, 4 ore e giornalieri
Coppie di valute: FX major, minors e cross
Sessioni di trading: Sessioni di Tokyo, Londra e New York
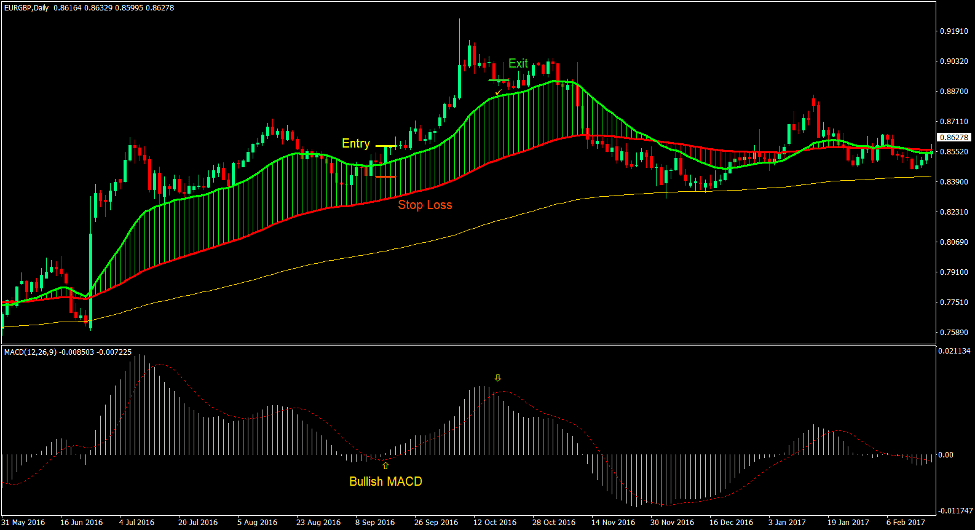
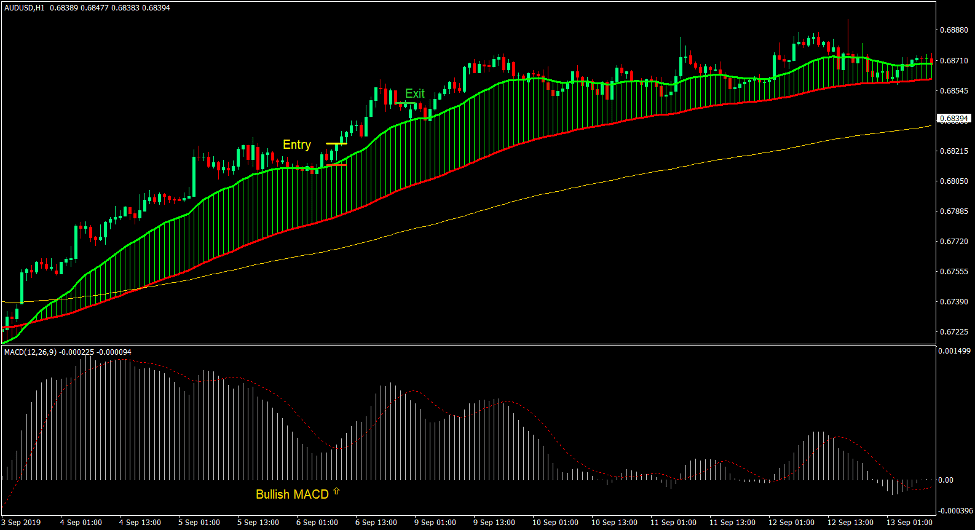
Acquista Trade Setup
Iscrizione
- 21 EMA dovrebbe essere superiore a 89 EMA, mentre anche 89 EMA è superiore a 200 EMA.
- La linea 89 e 200 EMA dovrebbe avere una pendenza ascendente.
- Il prezzo dovrebbe ritracciare verso l'area tra 21 EMA e 89 EMA, causando una temporanea inversione del MACD.
- L’azione dei prezzi dovrebbe indicare una ripresa del trend rialzista.
- Le barre MACD dovrebbero incrociarsi sopra la linea del segnale pur essendo positive.
- Inserisci un ordine di acquisto alla conferma di queste condizioni.
Stop Loss
- Imposta lo stop loss sul frattale sotto la candela di ingresso.
uscita
- Chiudi l'operazione non appena le barre MACD incrociano sotto la linea del segnale.
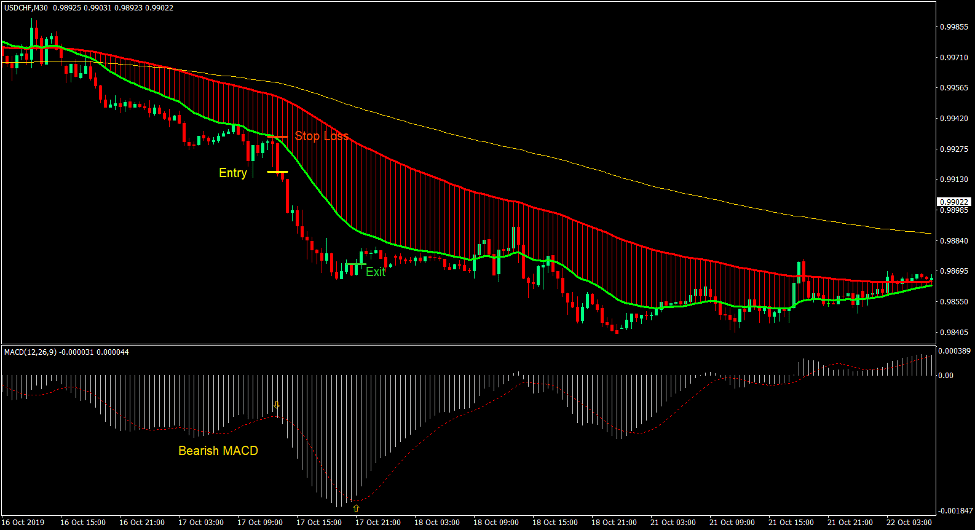
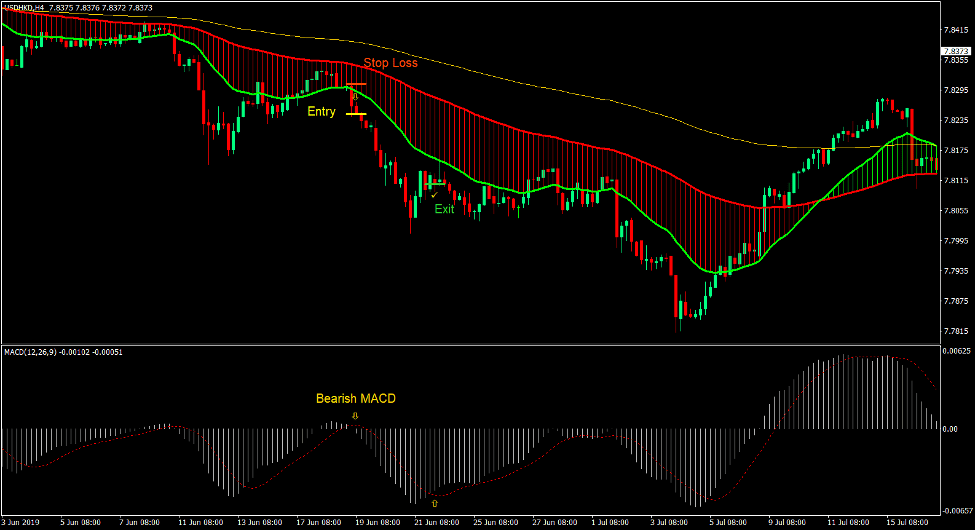
Vendi configurazione commerciale
Iscrizione
- 21 EMA dovrebbe essere inferiore a 89 EMA, mentre anche 89 EMA è inferiore a 200 EMA.
- La linea 89 e 200 EMA dovrebbe inclinarsi verso il basso.
- Il prezzo dovrebbe ritracciare verso l'area tra 21 EMA e 89 EMA, causando una temporanea inversione del MACD.
- L’azione dei prezzi dovrebbe indicare una ripresa del trend ribassista.
- Le barre MACD dovrebbero incrociarsi sotto la linea del segnale pur essendo negative.
- Inserisci un ordine di vendita sulla conferma di queste condizioni.
Stop Loss
- Imposta lo stop loss sul frattale sopra la candela di ingresso.
uscita
- Chiudi l'operazione non appena le barre MACD attraversano la linea del segnale.
Conclusione
Questa strategia di trading produce profitti regolari con un discreto rapporto rischio-rendimento, solitamente superiore a 1.5:1. Ciò consente ai trader di trarre profitto costantemente dal trading di mercato su forti trend dopo che il mercato si è ritracciato.
I trader che sono in grado di leggere abilmente le candele e l’azione dei prezzi possono trarre costantemente profitto dal mercato nel lungo periodo.
Broker MT4 consigliati
XM Broker
- Free $ 50 Per iniziare a fare trading all'istante! (Profitto prelevabile)
- Bonus di deposito fino a $5,000
- Programma fedeltà illimitato
- Broker Forex pluripremiato
- Bonus esclusivi aggiuntivi Durante tutto l'anno

>> Registrati per un conto broker XM qui <
Broker FBS
- Scambia 100 bonus: $ 100 gratuiti per iniziare il tuo viaggio nel trading!
- 100% Bonus: Raddoppia il tuo deposito fino a $ 10,000 e fai trading con un capitale maggiore.
- Utilizza fino a 1: 3000: Massimizzare i profitti potenziali con una delle opzioni di leva finanziaria più elevate disponibili.
- Premio "Miglior broker di assistenza clienti in Asia".: Eccellenza riconosciuta nell'assistenza e nel servizio clienti.
- Promozioni stagionali: Approfitta di una varietà di bonus esclusivi e offerte promozionali tutto l'anno.

>> Registrati per un conto broker FBS qui <
Clicca qui sotto per scaricare: