


Pedagang teknis telah mencoba menggabungkan statistik dengan perdagangan. Bagaimanapun, keunggulan perdagangan berdasarkan analisis teknis bergantung pada probabilitas. Namun, banyak upaya untuk melakukan hal tersebut seringkali terbukti sia-sia. Salah satu konsep statistik yang cukup menjanjikan dan sebenarnya telah digunakan oleh banyak trader adalah Regresi Linier. Strategi ini menunjukkan contoh indikator yang menggunakan regresi linier untuk membantu trader memahami grafik harga.
i-Indikator Regresi
Indikator i-Regresi adalah indikator teknis khusus yang didasarkan pada konsep statistik yang disebut Regresi Linier. Penggunaan regresi linier seperti itu memungkinkan pedagang untuk mengidentifikasi saluran harga dengan lebih mudah.
Indikator ini dikembangkan untuk mengidentifikasi saluran harga secara otomatis menggunakan regresi linier sebagai dasar untuk merencanakan rentang saluran. Hal ini dilakukan dengan menggunakan konsep Kurva Lonceng. Ini kemudian mengidentifikasi harga rata-rata berdasarkan distribusi harga. Langkah selanjutnya yang dilakukan algoritmenya adalah menggunakan deviasi standar untuk menghitung batas terluar kisaran sedemikian rupa sehingga persentase titik harga tertentu berada dalam kisaran tersebut. Misalnya, deviasi standar dua memperkirakan sekitar 95% titik data harga berada dalam kisaran saluran.
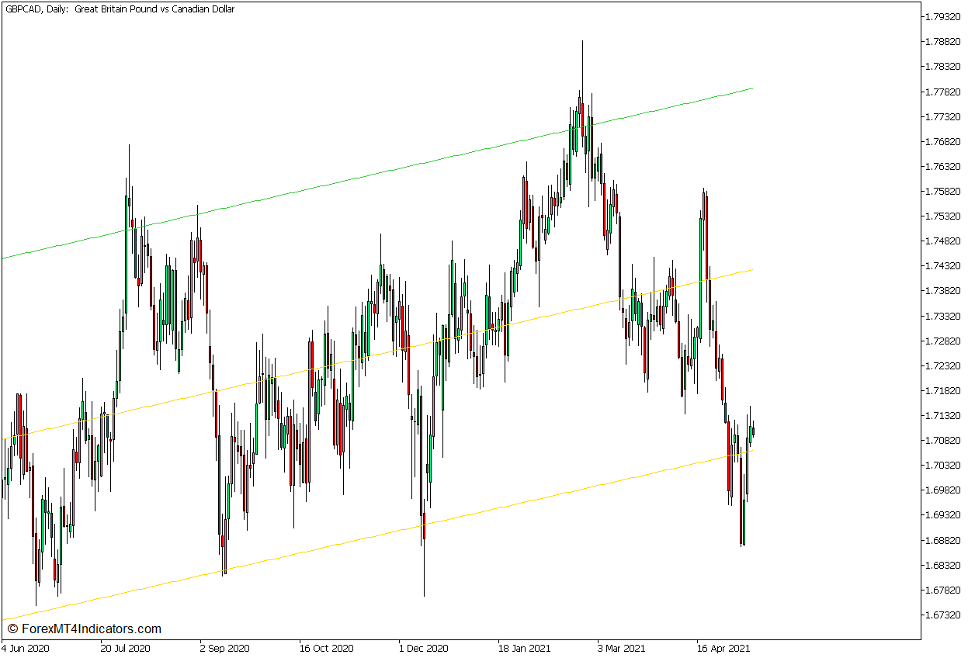
Indikator i-Regresi memiliki tiga pengaturan yang mengubah cara indikator memplot saluran. Jenis saluran pertama yang diplotnya adalah saluran regresi linier dasar. Ini memplot tiga garis lurus. Garis tengah mewakili harga rata-rata atau median kisaran. Garis atas dan bawah mewakili kisaran harga ekstrem atas dan bawah yang memungkinkan indikator mencakup sekitar 95% titik harga dalam saluran harga.
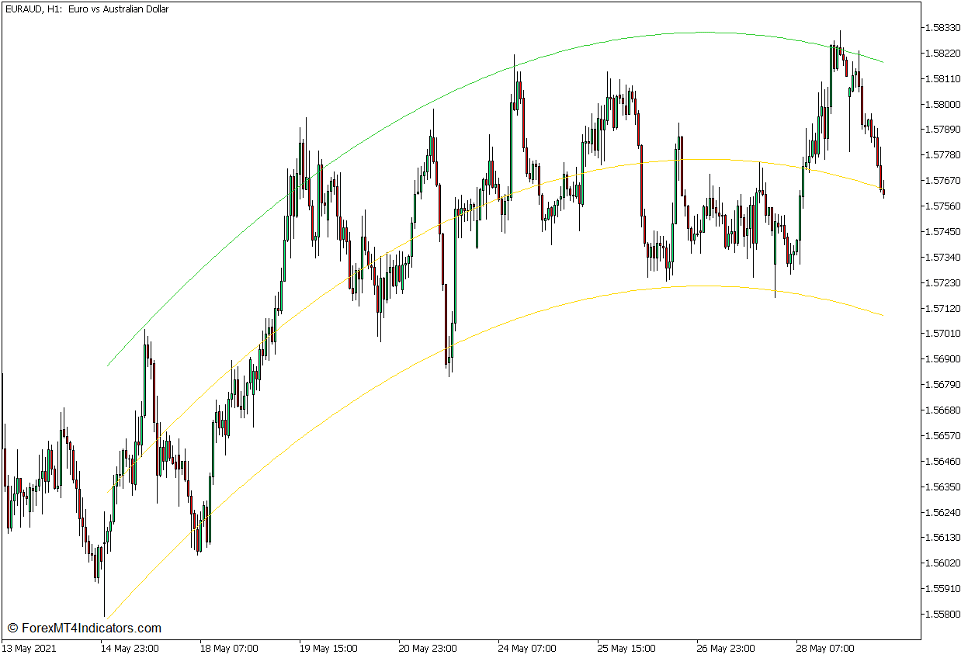
Jenis saluran selanjutnya yang diplotnya adalah jenis saluran parabola. Ini menggunakan rumus yang menyebabkan indikator memplot saluran yang akan melengkung satu kali. Hal ini memungkinkan pengguna untuk dengan mudah mengidentifikasi perubahan lintasan aksi harga.
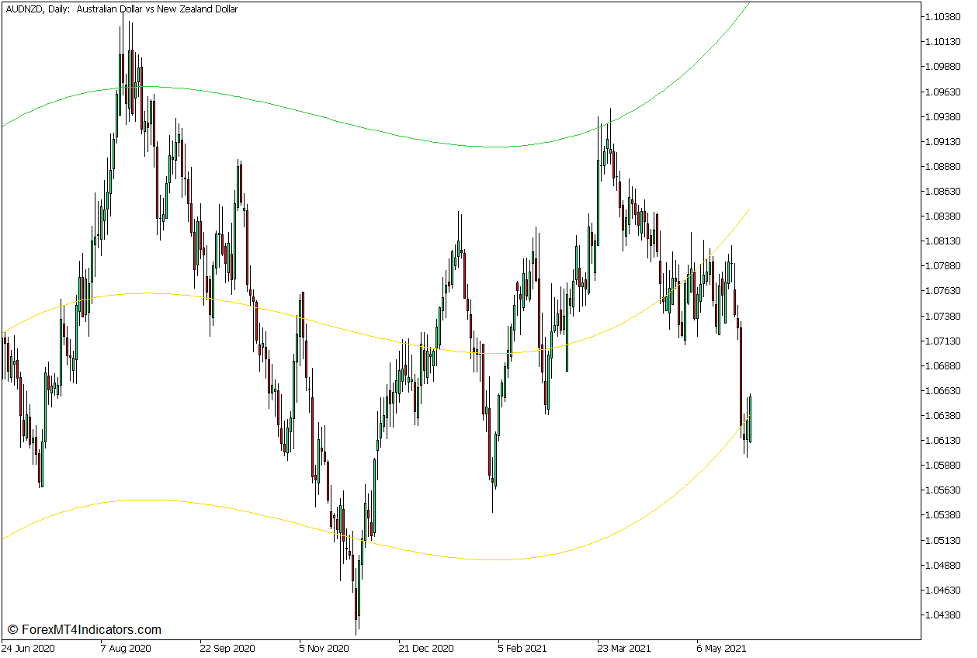
Jenis saluran terakhir yang diplot oleh indikator ini adalah saluran yang menggunakan rumus kubik. Hal ini memungkinkan indikator untuk memplot saluran yang akan menekuk pada dua titik. Hal ini memungkinkan identifikasi yang lebih tepat mengenai lintasan pergerakan harga.
Lilin Pin Bar dan Penolakan Harga
Pola kandil mungkin merupakan salah satu sinyal paling mentah dan paling cepat yang dapat digunakan oleh para pedagang. Hal ini karena pola candlestick menceritakan sebuah cerita yang menunjukkan arah yang mungkin diambil pasar. Pola kandil pembalikan khususnya merupakan tanda penolakan harga dan kemungkinan pembalikan momentum.
Pola Pin Bar mungkin merupakan salah satu pola kandil pembalikan momentum yang paling mendasar namun efektif yang dapat digunakan oleh para pedagang. Ini adalah pola kandil sederhana yang hanya terdiri dari satu kandil. Diidentifikasikan sebagai candle dengan badan yang sangat kecil dengan sumbu panjang di salah satu ujungnya dan sumbu kecil di ujung yang berlawanan. Arahnya dapat diidentifikasi berdasarkan letak sumbu panjang terhadap tubuhnya. Jika sumbu panjang berada di bawah badannya, candle akan diidentifikasi sebagai candle pin bar bullish. Di sisi lain, jika sumbu panjang berada di atas tubuhnya, maka candle mengindikasikan kemungkinan pembalikan bearish.
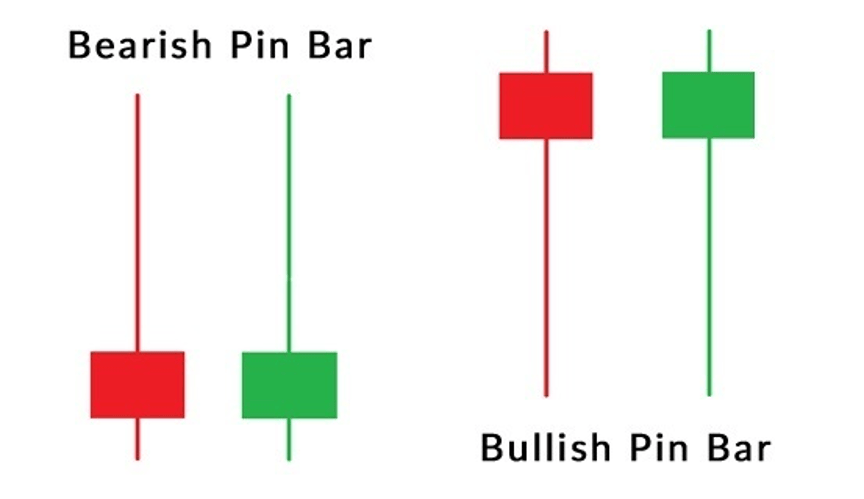
Pola Pin Bar adalah tanda kemungkinan pembalikan momentum karena pola ini menceritakan kisah penolakan harga. Hal ini memberitahu kita bahwa pasar tidak nyaman dengan tingkat harga tertentu dan dengan demikian pasar akan segera menolaknya, itulah sebabnya pasar akan dengan cepat pulih terhadap titik tertinggi atau terendah dan menutup di dekat ujung yang berlawanan, sehingga menghasilkan candle dengan sumbu yang panjang. dan tubuh kecil.
Konsep Strategi Perdagangan
i-Regression Parabolic Median Break Strategi Perdagangan Forex untuk MT5 adalah strategi perdagangan berbasis saluran sederhana yang memberikan sinyal perdagangan saat harga melintasi rata-rata saluran. Ia menggunakan Indikator i-Regresi untuk membantu pedagang mengidentifikasi saluran harga secara objektif. Secara khusus, kami akan menggunakan jenis saluran parabola. Hal ini memungkinkan kita untuk mengamati arah pergerakan harga, serta lintasan tren.
Kriteria pertama yang harus dipenuhi adalah persilangan yang kuat antara harga dan garis tengah saluran parabola i-Regression. Hal ini menunjukkan adanya pergeseran arah momentum. Namun, kami tidak akan melakukan perdagangan hanya berdasarkan persilangan antara harga dan median saluran. Kami akan membiarkan harga mundur ke garis tengah. Kita kemudian akan mengamati tanda-tanda penolakan harga di area sekitar garis tengah. Hal ini akan diidentifikasi dengan candle pin bar yang mendorong garis tengah saluran.
Beli Pengaturan Perdagangan
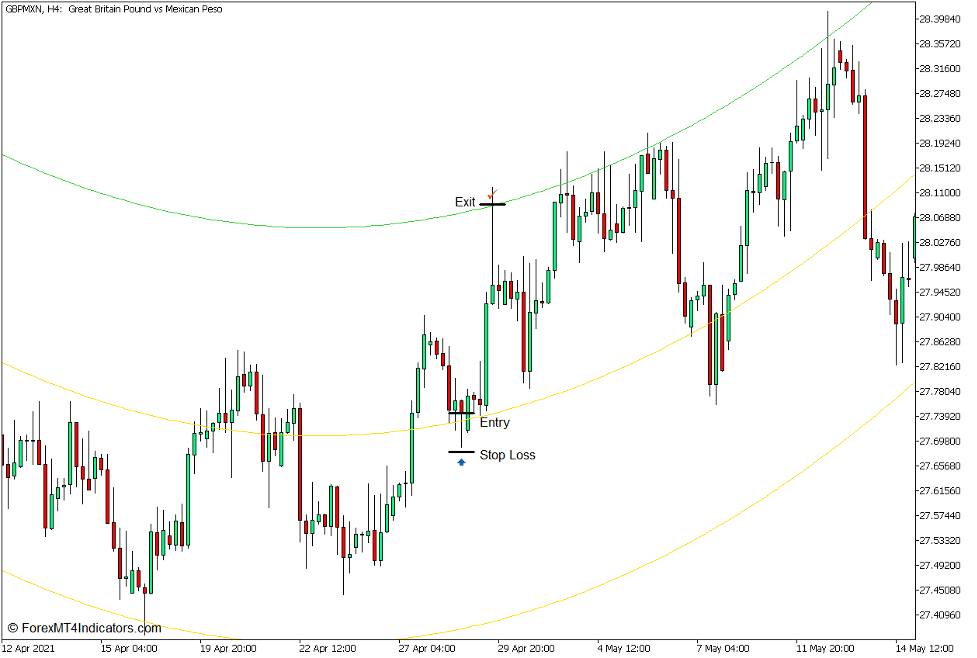
Masuk
- Harga harus melintasi di atas garis tengah saluran i-Regresi dengan momentum yang kuat.
- Biarkan harga mundur menuju garis tengah saluran.
- Buka order beli segera setelah candle pin bar bullish teridentifikasi yang menunjukkan penolakan harga di area tersebut.
Stop Loss
- Atur stop loss di bawah candle entri.
Exit
- Tutup perdagangan segera setelah harga menyentuh garis atas saluran i-Regresi.
Jual Pengaturan Perdagangan
Masuk
- Harga harus melintasi di bawah garis tengah saluran i-Regresi dengan momentum yang kuat.
- Biarkan harga mundur menuju garis tengah saluran.
- Buka order jual segera setelah candle pin bar bearish teridentifikasi yang menunjukkan penolakan harga di area tersebut.
Stop Loss
- Atur stop loss di atas candle entri.
Exit
- Tutup perdagangan segera setelah harga menyentuh garis bawah saluran i-Regresi.

Kesimpulan
Perdagangan berbasis saluran adalah salah satu strategi perdagangan paling dasar yang dapat digunakan para pedagang. Kebanyakan pedagang akan melakukan ini dengan merencanakan garis tren berdasarkan pergerakan harga. Namun, metode ini mungkin bersifat subyektif. Di sisi lain, strategi yang disebutkan di atas memungkinkan pedagang untuk mengidentifikasi saluran secara objektif menggunakan Indikator i-Regresi.
Salah satu variasi dari strategi ini adalah melakukan perdagangan pada penolakan harga yang terbentuk di garis atas atau bawah saluran. Hal ini memungkinkan imbal hasil yang lebih tinggi berdasarkan imbalan risiko.
Trader yang akan menggunakan strategi ini harus belajar membaca pergerakan harga karena ini adalah dasar fundamental dari sinyal perdagangan.
Broker MT5 yang Direkomendasikan
XM Broker
- Gratis $ 50 Untuk Memulai Trading Secara Instan! (Keuntungan yang Dapat Ditarik)
- Bonus Deposit hingga $5,000
- Program Loyalitas Tanpa Batas
- Pialang Forex Pemenang Penghargaan
- Bonus Eksklusif Tambahan Sepanjang tahun

>> Daftar Akun Broker XM di sini <
Pialang FBS
- Perdagangkan 100 Bonus: Gratis $100 untuk memulai perjalanan trading Anda!
- 100 Bonus Deposit%: Gandakan deposit Anda hingga $10,000 dan berdagang dengan modal yang ditingkatkan.
- Leverage hingga 1: 3000: Memaksimalkan potensi keuntungan dengan salah satu opsi leverage tertinggi yang tersedia.
- Penghargaan 'Broker Layanan Pelanggan Terbaik Asia': Keunggulan yang diakui dalam dukungan dan layanan pelanggan.
- Promosi Musiman: Nikmati berbagai bonus eksklusif dan penawaran promosi sepanjang tahun.

>> Daftar Akun Broker FBS di sini <
Klik di bawah ini untuk mengunduh: