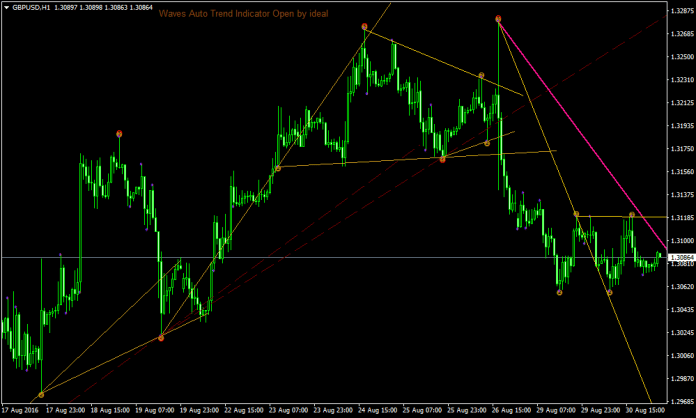
Wave Auto Trendlines Forex Support and Resistance Strategy
This strategy is a complex technical tool which gives new technology of the price analysis. It is a good assistant for identification and visual definition of classical price models.
it also forms the new point of view on principles of market price behavior analysis.
This system creates own model on the price chart during long testing and it uses semaphores and trendlines during the test.
Many of them are components of classical price models, but some of them have unique shape.
Such feature only expands practical opportunities of the indicator WATi use.
Lastly, any tool of similar type is intended to help organize successful trading activity in the markets.
The Use of WATI:
- For visual definition of classical price models: Head -shoulders, 123 pattern, Banners, Pennants and others
- For visual identification of «Likhovidov folding rule» price model
- For definition of formation places and construction of WOLFE WAVES
- For use together with B.William’s system “Alligator”
- For the simplified wave analysis and Elliot wave model identification.
Three Basic Elements of WATI:
1. Semaphores of the High, Low and Lowest periods
- The semaphores color marks by default:
- The High period – red circle with 3;
- The Low period – yellow circle with 2;
- The Lowest period – violet points;
2. Trend lines of the High and an Low periods
- Trend lines marks by default:
- The High period – a red faltering line;
- The Low period – a yellow continuous line;
3. The forecast trend line of the High period.
- Marks of a line by default:
- Pink line.
Indicator WATi trend lines assist to visually identifying Likhovidov folding rule price model.
Process of definition of Likhovidov folding rule price model consists of several stages:
- Definition of wave forms.
- Construction of trend lines.
Trend lines should allocate and emphasize wave forms which develop the tendency movement.
Indicator WATisemaphores for the simplified wave analyses
As it is already known, WATi semaphores are lit when any wave (pulse) shape is generated. Thus a semaphore
constant and not repaint.
Such feature allows to do the simplified market prices wave analysis, without deep studying a full rate of Elliott wave
analysis. In most cases, waves which were identified with indicator WATi, correctly display 5-wave model of price movement
as it is accepted according to Elliott theory. Therefore the wave analysis of the price chart by means of semaphores does not
represent the big work. It is necessary to place a digital marking of these waves only.
Recommended MT4 Brokers
XM Broker
- Free $50 To Start Trading Instantly! (Withdraw-able Profit)
- Deposit Bonus up to $5,000
- Unlimited Loyalty Program
- Award Winning Forex Broker
- Additional Exclusive Bonuses Throughout The Year
>> Sign Up for XM Broker Account here <<
FBS Broker
- Trade 100 Bonus: Free $100 to kickstart your trading journey!
- 100% Deposit Bonus: Double your deposit up to $10,000 and trade with enhanced capital.
- Leverage up to 1:3000: Maximizing potential profits with one of the highest leverage options available.
- ‘Best Customer Service Broker Asia’ Award: Recognized excellence in customer support and service.
- Seasonal Promotions: Enjoy a variety of exclusive bonuses and promotional offers all year round.
>> Sign Up for FBS Broker Account here <<
Click here below to download:


