


RSI Price Rejection Forex Strategy
Trading the markets is both a science and an art. It is a science because there are many ways to trade the market based on fixed and hard rules. There are trading ideas based on a fixed formula which are the basis for strategies. And there are ways to locate an optimal entry based on indicators, which are mathematically studied.
However, not only is it a science but it is also an art. It is an art because the market doesn’t follow hard and fixed rules. Price goes wherever it wants to go. This is because the market is composed of millions of traders worldwide, projecting and acting upon whatever they believe price should be. In a sense, the market is like a social experiment, with price as the end result of that experiment.
So, given that price is both a science and an art, this strategy will be marrying both concepts.
Relative Strength Index (RSI)
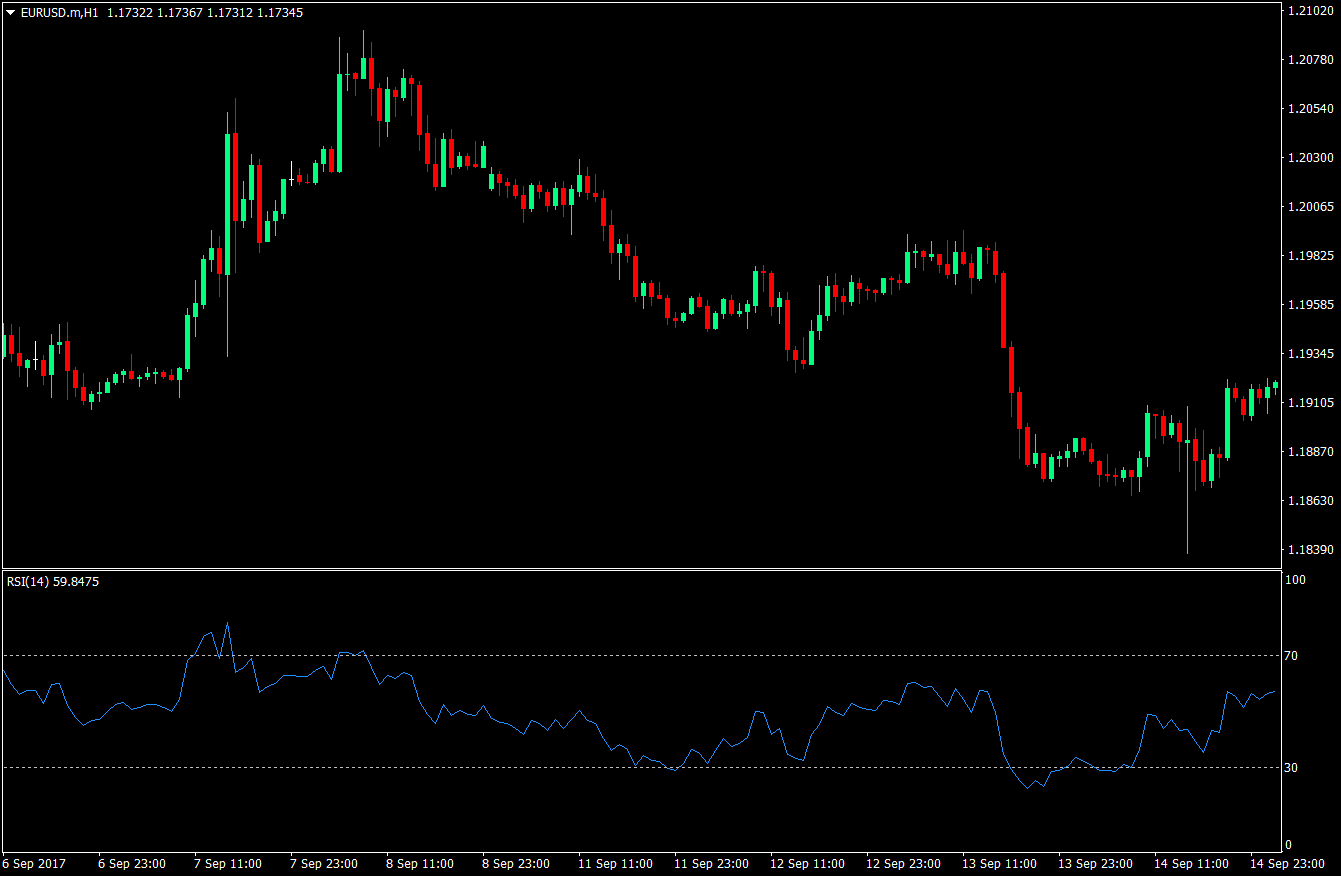
The Relative Strength Index, better known as RSI, will be the scientific aspect of this strategy, as it is based on a fixed formula. It is an oscillating indicator that measures price’s momentum or speed of change. This indicator oscillates within a range of zero to 100. It also has an overbought and oversold area represented by the 70 and 30-line. Having the RSI above the 70-line means that price is overbought. Having the RSI below the 30-line means that price is oversold.
This is what an RSI indicator looks like.
Price Action and Price Rejection
As mentioned earlier, trading the market is also an art because it is composed of many different traders projecting their beliefs on the market, and as traders, we make money by predicting what the market is thinking. Price action is one of the best ways to systematically read what the market is doing. Price action is basically the movement of price as it is plotted on a chart. It is a wide scope of study and different traders read price action in different techniques and perspectives. There are those who read swing highs and swing lows. Others look for retests of supports and resistances. Others read candlestick pattern.
For this strategy, we will be focusing on price rejection using the general behavior of a group of candlesticks. Some technical knowhow of candlestick patterns would also be beneficial. Trying to understand what the market is thinking based on the characteristics of candlesticks is one of the better ways to assess where price might be going.
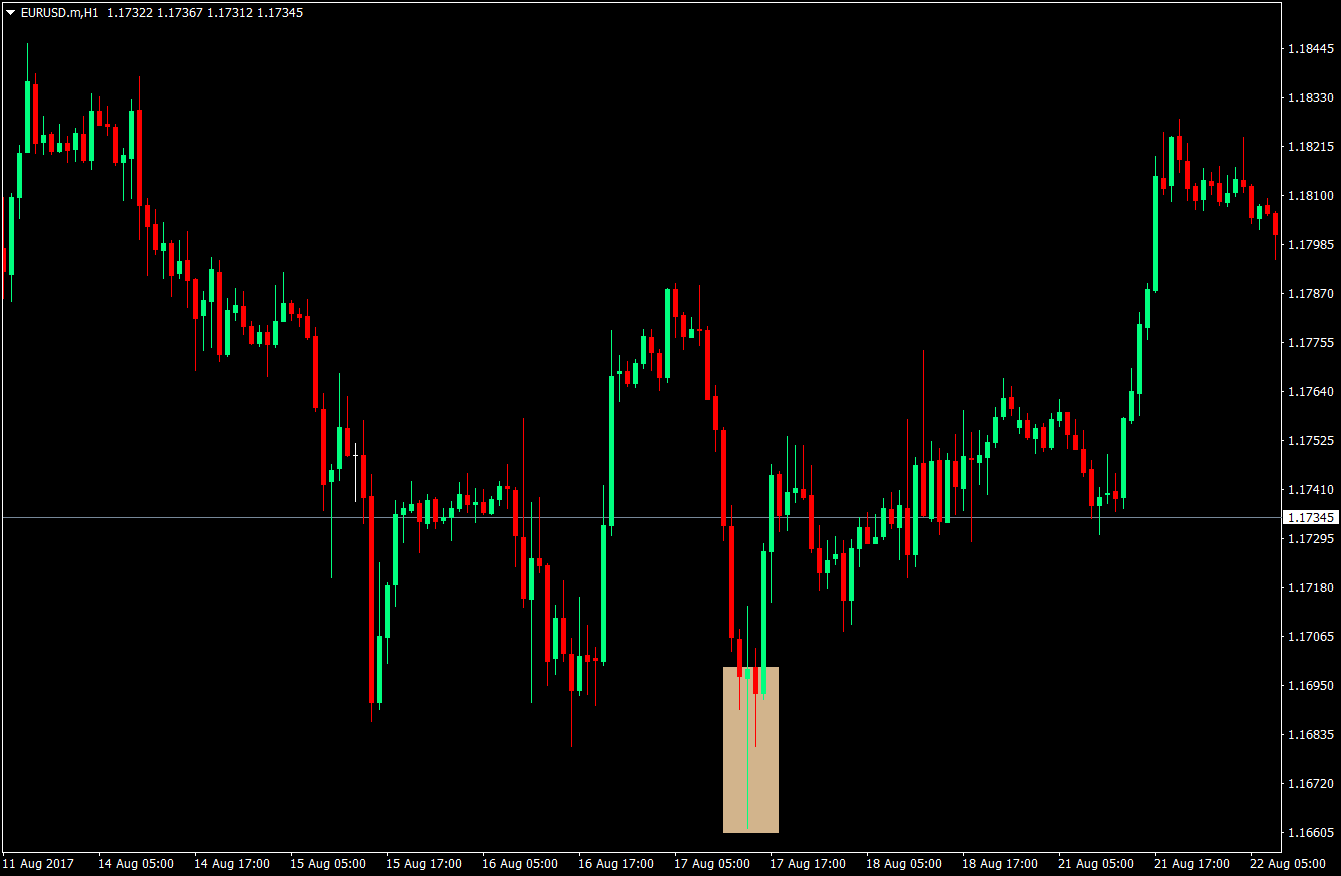
Price is said to be rejected if the most recent transactions tend to be going away from price’s previous low or high. If viewed on a chart using candlesticks, it would be a whole lot easier. What we will be looking for are candlesticks with long wicks or tails, since these indicate price rejection. Long wicks or tails below the candlestick signify that price is rejecting the low prices and might be pressured up. Long wicks at the top of a candle signify that high prices are being rejected, and price may soon reverse to the downside.
On this chart, you will notice that price is being rejected at the bottom by a series of candles. This is the type of characteristics that we will be looking for.
Long wicks at the bottom are not the only telltale sign of a reversal. Several candlestick patterns without long wicks on one side could also mean a reversal. A doji may signify indecisiveness and may result to a reversal. Engulfing patterns, piercing lines, dark cloud, 3 soldiers and some other candlestick patterns may also signify a reversal, although without the long one-sided wicks. This is why some knowledge of candlestick patterns would also be very useful.
The Buy Setup – Entries, Stop Losses & Exits
To enter a buy trade setup, these two rules must be met:
- The RSI should be below the 30-level signifying that price is oversold
- A recognizable bullish price rejection or bullish reversal pattern is in confluence with the oversold RSI
Stop Loss: The stop loss should be placed a few pips below the lowest low of the bullish price rejection or the bullish reversal pattern.
Take Profit: The take profit would be in two tranches. Half of the trade would be closed as soon as the 50-level RSI is hit. The remaining half would be closed as soon as price reaches the 70-level.
Trailing Stop: The stop loss should be trailed to break even plus spread as soon as the 50-level RSI is hit.
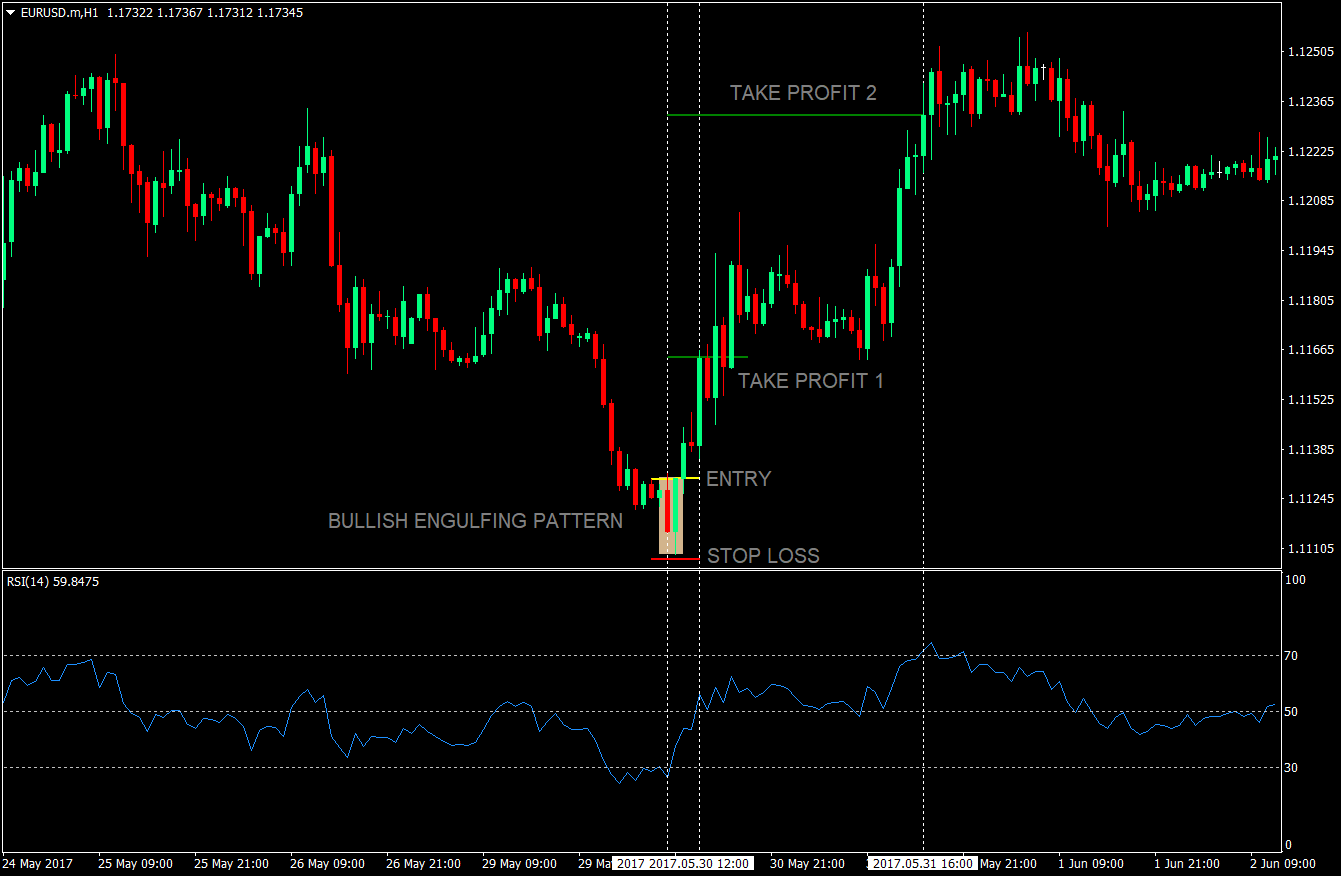
On this chart, a bullish engulfing pattern is found in confluence with the oversold RSI. This should be the trigger to enter a buy trade. As soon as the RSI reached the 50-level, half of the position should have been closed, and the stop loss should have been trailed to breakeven plus spread. On this trade, it was fortunate that the 70-level was reached for a handsome profit of 102 pips.
The Sell Setup – Entries, Stop Losses & Exits
To enter a sell setup, the following rules must be met:
- The RSI is above the 70-level signifying that price is overbought
- A recognizable bearish price rejection or bearish reversal pattern is in confluence with the oversold RSI
Stop Loss: The stop loss should be placed just a few pips above the highest high of the bearish price rejection or reversal pattern.
Take Profit: Half of the position should be closed as soon as the 50-level RSI is hit, and the remaining half should be closed as soon as the 30-level RSI is hit.
Trailing Stop Loss: The stop loss should be trailed to breakeven plus spread as soon as the 50-level RSI is hit.
On this chart, a candle with a long upper wick was found in the area where the RSI touched the 70-level. This ticked all the rules and is a trigger to enter a sell trade. The trade didn’t go down immediately, but soon enough price did drop and the 50-level was hit. Then price continued dropping until the 30-level was hit for a profit of 51 pips.
Conclusion
This is a very robust strategy for several reasons.
First, this strategy doesn’t cause traders to chase prices but instead wait for price to reach a certain overbought or oversold level using the RSI. Second, a non-lagging entry trigger is used, since the price action and reversal patterns itself are the trigger for entries. And lastly, since the trades are usually entered at the beginning of the swing, trades usually close in profit with a very good risk reward ratio.
The only thing to note though is that knowledge of price action and some experience observing and using price action and reversal patterns is necessary to be proficient with this strategy. However, if this strategy is mastered, it would be a very robust strategy to use.
Recommended MT4 Broker
- Free $50 To Start Trading Instantly! (Withdrawable Profit)
- Deposit Bonus up to $5,000
- Unlimited Loyalty Program
- Award Winning Forex Broker
- Additional Exclusive Bonuses Throughout The Year

>> Claim Your $50 Bonus Here <<
Click here below to download: