


Trending markets can provide excellent trading opportunities because it is easy to identify the direction where the market is moving. Traders simply need to identify the direction of the trend and trade in that direction. After doing so, traders should then identify the entry level where they would want to open a trade. Pullbacks are great options as it allows traders to enter a trending market at a near optimum price level. This trading strategy shows us how we can trade pullbacks on a trending market using the RSI of MACD Double indicator.
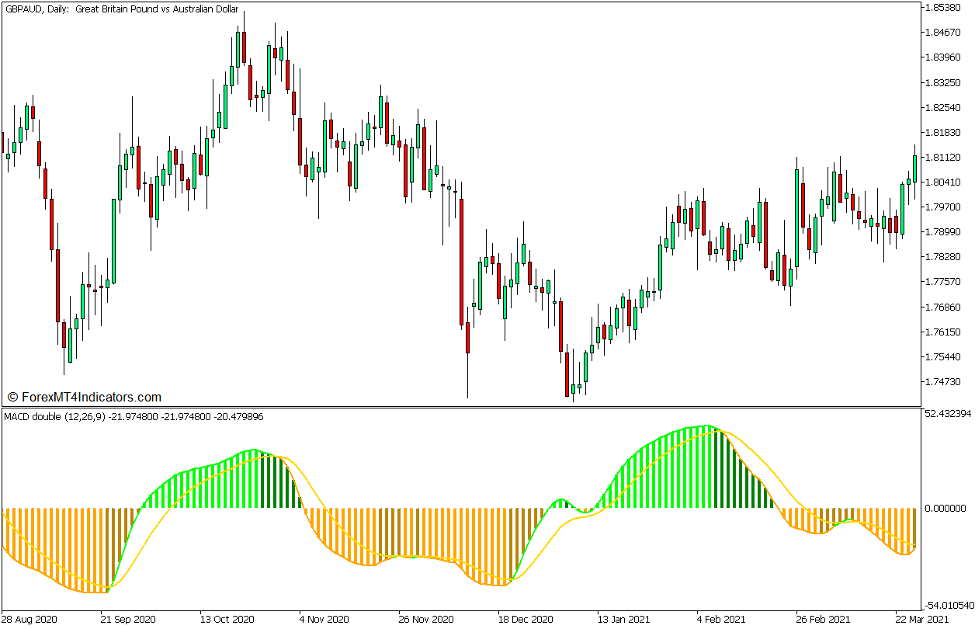
RSI of MACD Double Indicator
The RSI of MACD Double Indicator is a custom indicator which is derived from the Relative Strength Index (RSI) and the Moving Average Convergence and Divergence (MACD).
The RSI is a classic oscillator type of indicator which is used to help traders identify momentum direction. It measures momentum of the market by calculating for the magnitude of recent price changes. It can also be used to identify overbought and oversold markets based on its oscillator line reaching the upper or lower end of its range.
The MACD on the other hand is also a momentum indicator which presents trend direction by calculating for the difference between two Exponential Moving Average (EMA) lines. The difference between the two underlying EMA lines is used to plot the MACD line or histogram bars. It also computes for the Simple Moving Average (SMA) of the MACD line, the result of which is plotted as a signal line which follows the movements of the main MACD line.
The RSI of MACD Double Indicator is a modified version of the MACD. Instead of using the basic closing price of each bar, this indicator uses an underlying RSI calculation to compute for its MACD line. In a way, it is a MACD derived from the RSI. It calculates for two EMA lines based on the RSI, the result of which is used to plot its MACD line. Just as with regular MACDs, it also calculates for the SMA of the MACD line, which becomes its signal line.
It also plots histogram bars along with its MACD line. These histogram bars change colors depending on whether the bars are positive or negative, and whether the values are rising or dropping. Lime bars indicate positive bars with increasing values, while green bars indicate positive bars with decreasing values. On the other hand orange bars indicate negative bars with decreasing values, while goldenrod bars indicate negative bars with increasing values.
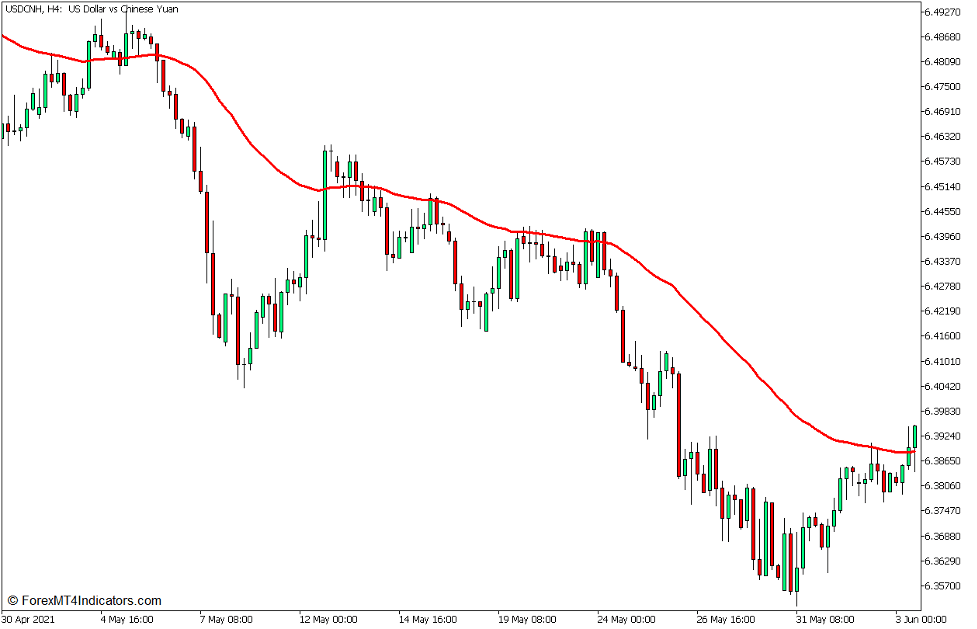
50 Exponential Moving Average
Most moving average lines tend to be too lagging, causing traders to make trade decisions a little too late. For this reason, traders have been exploring for ways to decrease the lag of moving average lines.
An Exponential Moving Average (EMA) is a type of moving average line which places more weight on more recent price data relative to its preceding historical price data. By doing so, the EMA creates a moving average line which has less lag when compared to the basic moving average line, making it more responsive to trend and momentum reversals and oscillations, while at the same time retaining its smoothness.
The 50-bar EMA line is widely used as a medium term moving average line. Traders often identify the general trend direction based on the general location of price action in relation to the 50 EMA line. It also follows that trend direction can also be identified based on the slope of the 50 EMA line, whether it is sloping upwards or downwards.
The 50 EMA line can also be used as a dynamic area of support or resistance. Traders can use the area near the 50 EMA line as an area of support during an uptrend, and as an are of resistance during a downtrend.
Trading Strategy Concept
RSI of MACD Double Trend Swing Forex Trading Strategy for MT5 is a trend continuation strategy which trades along a trending market as it oscillates up and down the price chart. It attempts to trade at the end of a deep market pullback, which can be commonly observed as market swings.
The 50 EMA line is used mainly as the trend direction filter. This is based on where price action generally is in relation to the 50 EMA line, as well as the slope of the line.
It is also used as a dynamic area of support or resistance. The area around the 50 EMA line is where we could anticipate the pullbacks of a trending market to move towards and bounce from.
The RSI of MACD Double indicator is used as our trade entry signal, which should be in confluence with the trend direction based on the 50 EMA. The trade entry signal is based on the color change of the histogram bars that it plots.
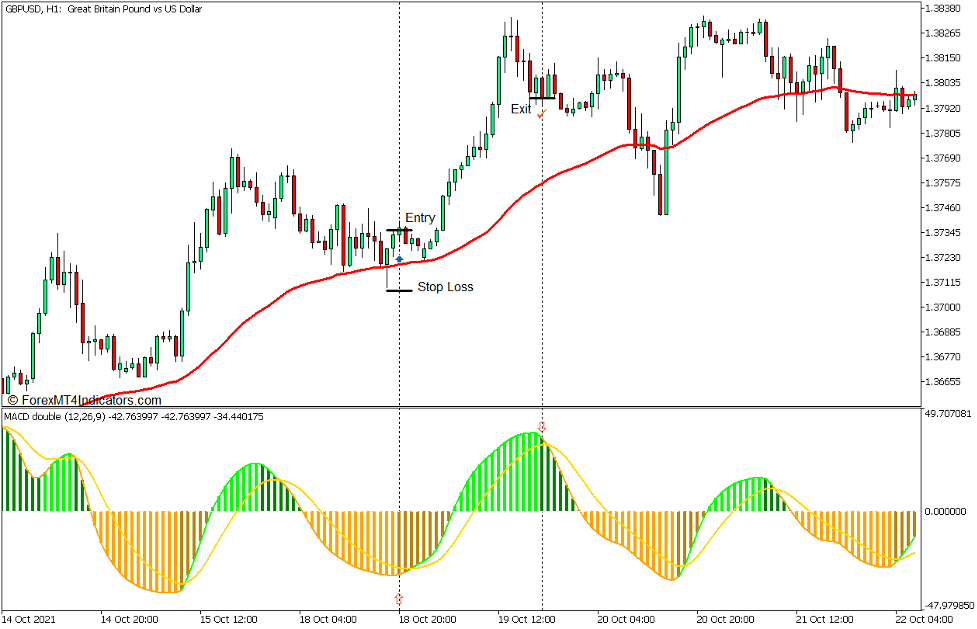
Buy Trade Setup
Entry
- The 50 EMA line should slope up while price action is generally above the 50 EMA line.
- Allow price to pull back towards the 50 EMA line.
- Open a buy order as soon as the RSI of MACD Double histogram bars change to goldenrod indicating a bullish momentum reversal.
Stop Loss
- Set the stop loss on the fractal below the entry candle.
Exit
- Close the trade as soon as the RSI of MACD Double bars change to green indicating a possible bearish momentum reversal.
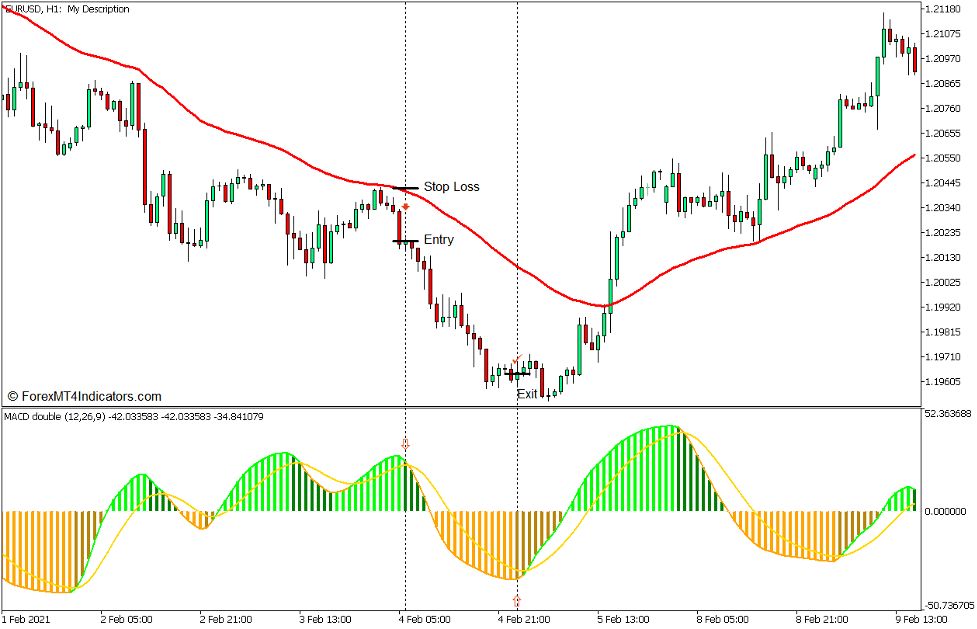
Sell Trade Setup
Entry
- The 50 EMA line should slope down while price action is generally below the 50 EMA line.
- Allow price to pull back towards the 50 EMA line.
- Open a sell order as soon as the RSI of MACD Double histogram bars change to green indicating a bearish momentum reversal.
Stop Loss
- Set the stop loss on the fractal above the entry candle.
Exit
- Close the trade as soon as the RSI of MACD Double bars change to goldenrod indicating a possible bullish momentum reversal.
Conclusion
This trading strategy can be a good method for trading with the trend as it allows traders to trade on pullbacks. However, there are instances wherein the color change of the bars can still be a little late, which is common for many indicators. Traders can adjust the variables within the indicator settings to make the indicator more responsive to price movements and decrease lag further.
Recommended MT5 Brokers
XM Broker
- Free $50 To Start Trading Instantly! (Withdraw-able Profit)
- Deposit Bonus up to $5,000
- Unlimited Loyalty Program
- Award Winning Forex Broker
- Additional Exclusive Bonuses Throughout The Year

>> Sign Up for XM Broker Account here <<
FBS Broker
- Trade 100 Bonus: Free $100 to kickstart your trading journey!
- 100% Deposit Bonus: Double your deposit up to $10,000 and trade with enhanced capital.
- Leverage up to 1:3000: Maximizing potential profits with one of the highest leverage options available.
- ‘Best Customer Service Broker Asia’ Award: Recognized excellence in customer support and service.
- Seasonal Promotions: Enjoy a variety of exclusive bonuses and promotional offers all year round.

>> Sign Up for FBS Broker Account here <<
Click here below to download: