


One of the reasons why many new traders find it very difficult to profit from the forex market is because they do not trade in the direction of the trend. In some cases, it is a matter of having a strategy that is not fit for trading with the trend. On many occasions, it is because of the fear of taking the trade at the end of a trend.
While it is true that traders should avoid chasing the trend, trading in the direction of the trend also implies that you would have to trade in the middle of the trend rather than at the beginning of the trend. Sure, the yields might not be as high as if the trade was taken at the beginning of the trend. Sure, there is a risk that the trend might soon reverse. However, trading with the trend could also mean trading with a higher probability of winning.
On the other hand, anticipating trend reversals also do present huge risks. Although it is true that trades would have higher yields because the trade is taken at the beginning of the trend, catching trend reversals as price reverses could also be very difficult.
Oracle Move
Oracle Move or 100 Pips Momentum is a custom trend following technical indicator which is based on a short-term moving average.
Most moving average lines tend to have two weaknesses. First, most moving average lines tend to be lagging compared to price action. Lagging indicator signals often cause traders to enter a good trade setup and exit a winning trade a bit too late. This often drastically reduces the potential profits which the trader could have earned or worse, turn a potentially winning trade into a loss. The second weakness is that many moving averages tend to be susceptible to false signals that occur during whipsaws and choppy market conditions. This causes traders to enter a trade which they should have not traded in the first place.
Oracle Move is an indicator that plots two short-term moving average lines which drastically minimizes both weaknesses. The lines that this indicator plots are very responsive to price action movements making it suitable for short-term momentum shifts, and at the same time are very smooth making it handle choppy market conditions better.
The faster moving average line is plotted as a blue line, while the slower moving average line is plotted as a red line. Trend direction is then identified based on how the two moving average lines overlap. The trend is bullish if the blue line is above the red line and bearish if the blue line is below the red line. Crossovers between the two lines can also be indicative of a potential trend reversal.
Relative Strength Index
The Relative Strength Index (RSI) is a classic oscillator type of technical indicator which has a variety of uses. It can be used to identify trend, momentum and overbought or oversold price conditions.
The RSI is an oscillator that plots a line that oscillates between the range of 0 to 100. This line is computed based on the closing price of a recent trading period compared to its historical price movements. The resulting line is a line that somewhat mimics the movements of price action based on its swing points.
The RSI has markers at 30 and 70. These markers indicate overbought or oversold price conditions. An RSI line above 70 is indicative of an overbought market, while an RSI line below 30 indicates an oversold condition. Inversely, momentum traders identify strong breaches beyond these levels as an indication of a strong momentum which could lead to a trend.
Some traders add markers at level 45, 50 and 55. Level 50 marks the trend bias. An RSI line generally staying above 50 and finding support at 45 is indicative of a bullish trend. On the other hand, an RSI line generally staying below 50 and finding resistance at 55 is indicative of a bearish trend.
Trading Strategy
Oracle Move Trend Following Forex Trading Strategy is a trend following strategy which finds agreements between the long-term trend and the short-term trend using the Oracle Move indicator, the 100-period Exponential Moving Average (EMA), and the RSI.
The long-term trend is identified based on the slope of the 100 EMA line, the location of price action in relation to the 100 EMA line, as well as the trend direction of price action.
The RSI line then confirms the trend based on where it is generally located in relation to the 50 marker and whether it is finding support at level 45 or resistance at level 55.
Price would generally retrace to its median. This should cause the Oracle Move line to temporarily reverse and the RSI line to temporarily retrace to the area near 50, while still finding support or resistance at level 45 or 55.
As price resumes its trend, the Oracle Move line would crossover and the RSI line would break above 55 or drop below 45 indicting the resumption of the trend. This confluence would be our trade setup.
Indicators:
- 100pips Momentum
- 100 EMA
- Relative Strength Index
Preferred Time Frames: 30-minute and 1-hour charts
Currency Pairs: FX majors, minors and crosses
Trading Sessions: Tokyo, London and New York sessions
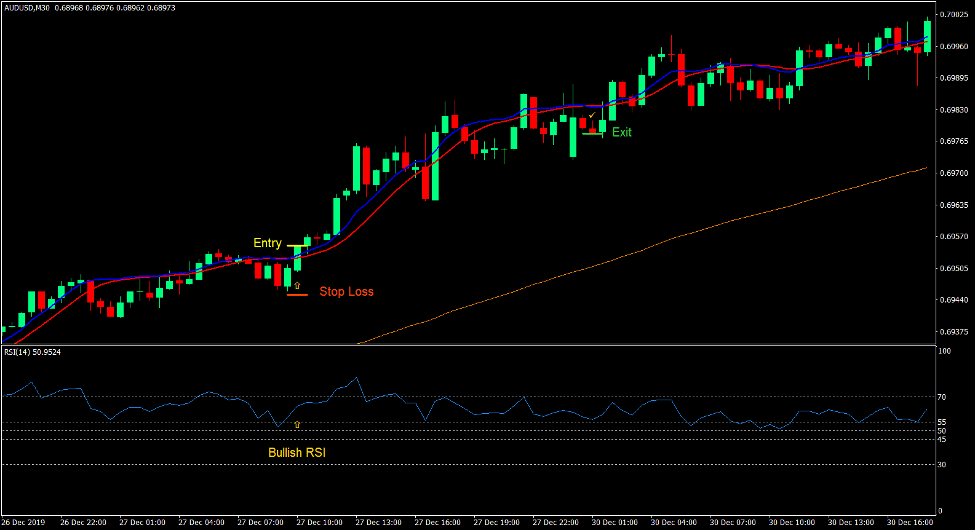
Buy Trade Setup
Entry
- Price action should be above the 100 EMA line.
- Price action should be trending up based on its price swings.
- The 100 EMA line should slope up.
- The RSI line should generally be above 50.
- Price should retrace causing the blue Oracle Move line to temporarily cross below the red line and the RSI line to retrace towards 50 while finding support at 45.
- The blue Oracle Move line should cross above the red line.
- The RSI line should breach above 55.
- Enter a buy order on the confirmation of these conditions.
Stop Loss
- Set the stop loss at the support below the entry candle.
Exit
- Close the trade as soon as the blue line of the Oracle Move indicator crosses below the red line.

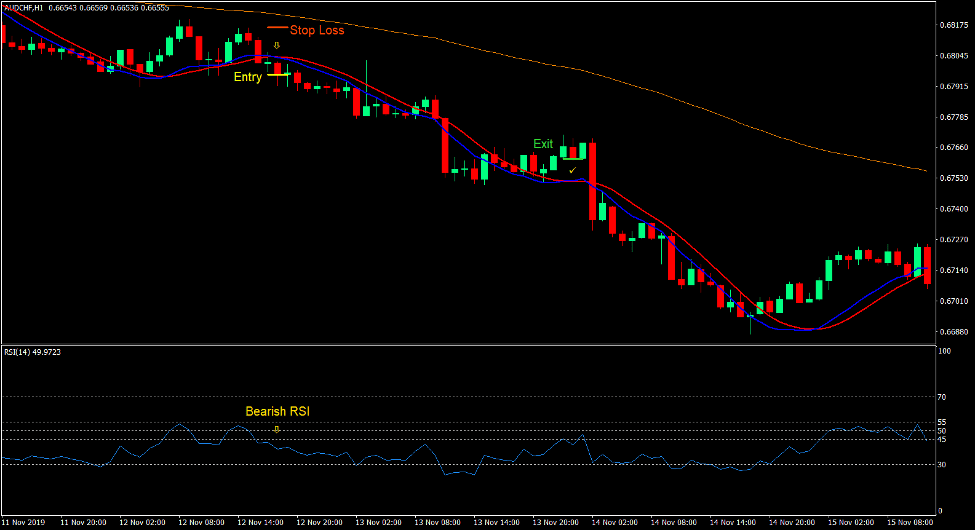
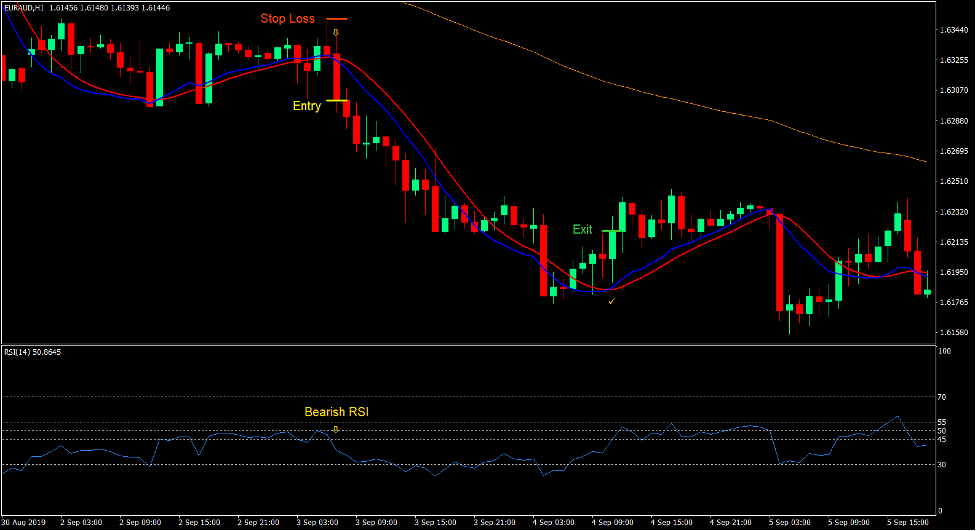
Sell Trade Setup
Entry
- Price action should be below the 100 EMA line.
- Price action should be trending down based on its price swings.
- The 100 EMA line should slope down.
- The RSI line should generally be below 50.
- Price should retrace causing the blue Oracle Move line to temporarily cross above the red line and the RSI line to retrace towards 50 while finding resistance at 55.
- The blue Oracle Move line should cross below the red line.
- The RSI line should drop below 45.
- Enter a sell order on the confirmation of these conditions.
Stop Loss
- Set the stop loss at the resistance above the entry candle.
Exit
- Close the trade as soon as the blue line of the Oracle Move indicator crosses above the red line.
Conclusion
This trading strategy is a basic trend following or trend re-entry strategy which makes use of the responsive short-term signals of the Oracle Move indicator.
The Oracle Move indicator in itself is not perfect yet it provides high probability trend reversal signals which has the potential to result in a trend.
The combination of the 100 EMA line and the trend indication of the RSI line simply confirms the direction of the general trend, which in turn should leave us with high probability trend following trade setups.
Recommended MT4 Brokers
XM Broker
- Free $50 To Start Trading Instantly! (Withdraw-able Profit)
- Deposit Bonus up to $5,000
- Unlimited Loyalty Program
- Award Winning Forex Broker
- Additional Exclusive Bonuses Throughout The Year

>> Sign Up for XM Broker Account here <<
FBS Broker
- Trade 100 Bonus: Free $100 to kickstart your trading journey!
- 100% Deposit Bonus: Double your deposit up to $10,000 and trade with enhanced capital.
- Leverage up to 1:3000: Maximizing potential profits with one of the highest leverage options available.
- ‘Best Customer Service Broker Asia’ Award: Recognized excellence in customer support and service.
- Seasonal Promotions: Enjoy a variety of exclusive bonuses and promotional offers all year round.

>> Sign Up for FBS Broker Account here <<
Click here below to download: