Different traders have different approaches and styles when trading the forex market. Although some traders may strongly believe that their approach is either the best or is the only way to trade, truth is forex trading could be executed using different methods. As they say, there is more than one way to skin a cat.
One of the major differences among traders is that of traders who use technical indicators and those that avoid technical indicators. Both camps strongly believe that the opposite approach is the worst way to trade the market. Yet there are many traders who profit using one or the other.
Traders who use technical indicators usually believe that technical indicators are the best tools for trading. It allows them to see things that they would otherwise have not seen without an indicator. It also allows them to make systematic trade decisions.
On the other hand, traders who avoid technical indicators usually use price action, candlestick patterns or supply, market flow or supply and demand on naked charts. They often believe that trading with indicators only causes them to make decisions too late.
Although most traders fall on either side of the spectrum, there are many traders who also mix and match both approaches.
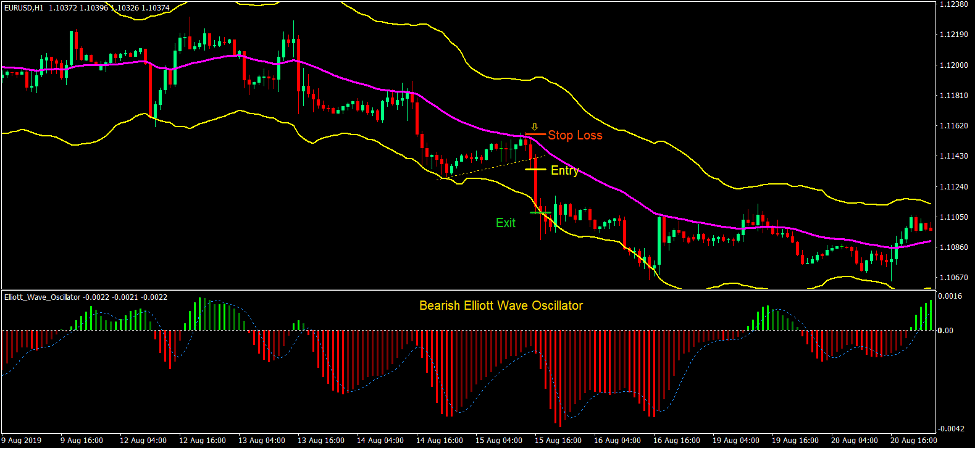
Trend Band Breakout Forex Trading Strategy uses an approach which incorporates technical indicators as well as price action and candlestick patterns in order to trade the market effectively.
Trend Bands Indicator
The Trend Bands indicator is a channel or band type indicator which allows traders to identify trend direction bias, momentum and oversold or overbought market conditions.
Trend Bands plots three lines. It plots a middle line which is a modified moving average line. This line is primarily used to identify trend direction based on the slope of the line and the general location of price action in relation to the midline.
It also plots outer lines which are placed above and below the midline. These lines are derived from the midline and incorporates volatility in its computation. These lines are usually used to identify overbought and oversold market conditions.
When combined, the three lines create a band that has two sections. If price action is generally on the upper portion of the band, then the market is in a bullish trending bias. If price action is generally on the lower portion, then the market is in a bearish trending bias.
If price is touch the outer lines and is showing signs of price rejection, then the market could be reversing to its mean. On the other hand, if price breaches the outer bands strongly, then the market might be gaining a strong momentum.
Elliott Wave Oscillator
The Elliott Wave Oscillator (EWO) is a simple trend following technical indicator which is displayed as an oscillator.
It is based on the crossover of a pair of Simple Moving Averages (SMA) and is plotted as histogram bars on a separate window.
It is computed by looking for the difference between a 5-bar Simple Moving Average (SMA) and a 35-period Simple Moving Average (SMA). It uses the close of each candlestick as its basis and plots the results as bars that oscillate around zero. Positive bars generally indicate a bullish trend bias, while negative bars generally indicate a bearish trend bias.
This version of the Elliott Wave Oscillator is modified. It plots the usual histogram bars, but it also plots a dotted line which is derived from the original EWO bars. Traders could use the crossing over of the dotted lines and the bars as a possible trend reversal signal.
The bars also change color depending on whether the trend is strengthening or weakening. Lime bars indicate a strengthening bullish trend, green bars indicate a weakening bullish trend, red bars indicate a strengthening bearish trend, and maroon bars indicate a weakening bearish trend.
Trading Strategy
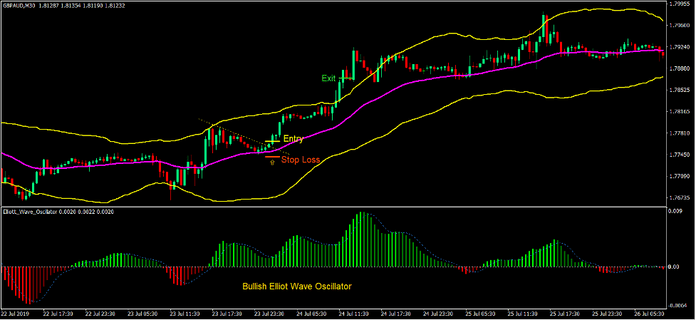
This trading strategy is a trend following strategy which produces trade setups whenever price retraces to the midline of the Trend Bands indicator.
To identify the trend, we will be looking at how price action behaves in relation to the Trend Bands. Price action should mostly reside on the half of the Trend Bands indicator where the trend is moving, with occasional pulses breaching outside the band.
The trend is then further confirmed using the Elliott Wave Oscillator. This is based on whether it is producing positive or negative bars predominantly.
We then wait for retracements to the midline of the Trend Bands indicator. As price retraces a support or resistance line should be clearly observable. We then take trades based on breakouts from the support or resistance line.
Indicators:
- Trend_Bands
- Elliott_Wave_Oscillator
Preferred Time Frames: 30-minute, 1-hour, 4-hour and daily charts
Currency Pairs: FX majors, minors and crosses
Trading Sessions: Tokyo, London and New York sessions
Buy Trade Setup
Entry
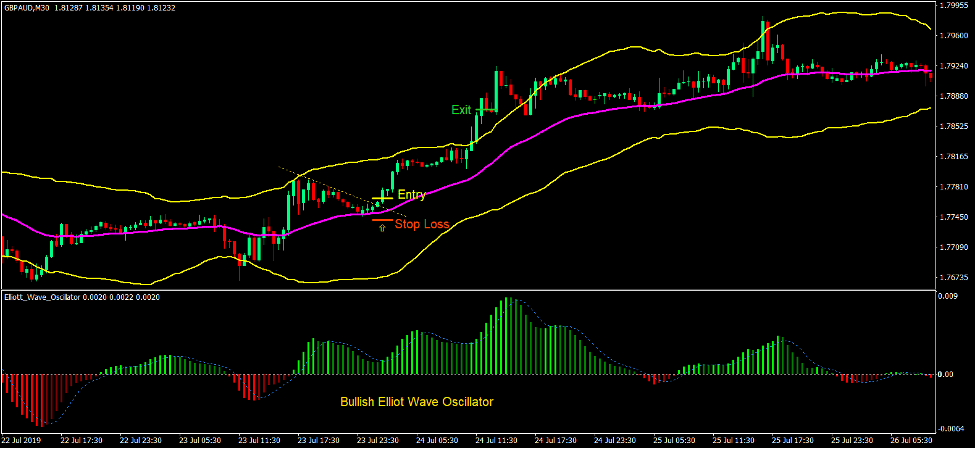
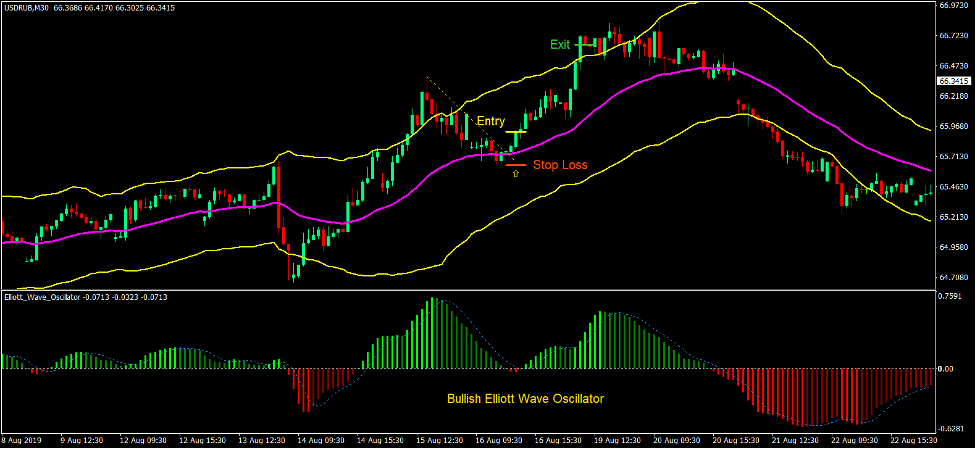
- Price action should mostly be on the upper half of the Trend Bands.
- The Elliott Wave Oscillator bars should mostly be positive.
- Price should retrace to the midline of the Trend Bands.
- A diagonal resistance line should be visible.
- Price should breakout above the resistance line.
- Enter a buy order upon confirmation of these conditions.
Stop Loss
- Set the stop loss on the support level below the entry candle.
Exit
- Close the trade as soon as bearish reversal candlestick patterns form above the upper line of the Trend Bands.
Sell Trade Setup
Entry
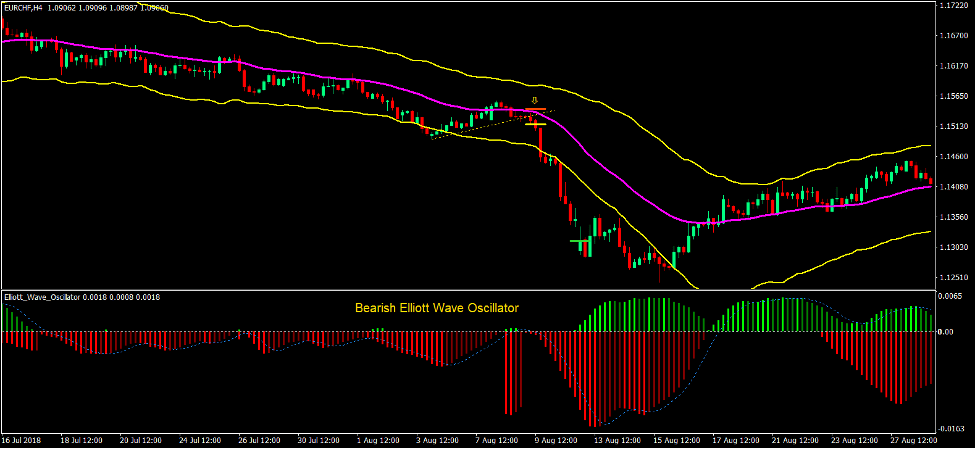
- Price action should mostly be on the lower half of the Trend Bands.
- The Elliott Wave Oscillator bars should mostly be negative.
- Price should retrace to the midline of the Trend Bands.
- A diagonal support line should be visible.
- Price should breakout below the support line.
- Enter a sell order upon confirmation of these conditions.
Stop Loss
- Set the stop loss on the resistance level above the entry candle.
Exit
- Close the trade as soon as bullish reversal candlestick patterns form below the lower line of the Trend Bands.
Conclusion
This trading strategy works well in trending market conditions because it makes use of entries based on retracements and breakouts from resistances, which are common during trending market conditions.
It also allows traders to filter out non-trending markets effectively using the two technical indicators. Trading the right market condition significantly increases the probability of a winning trade setup.
Traders who could identify the correct market condition, the right retracement pattern, and the right breakout candle could profit immensely using this strategy.
Recommended MT4 Brokers
XM Broker
- Free $50 To Start Trading Instantly! (Withdraw-able Profit)
- Deposit Bonus up to $5,000
- Unlimited Loyalty Program
- Award Winning Forex Broker
- Additional Exclusive Bonuses Throughout The Year
>> Sign Up for XM Broker Account here <<
FBS Broker
- Trade 100 Bonus: Free $100 to kickstart your trading journey!
- 100% Deposit Bonus: Double your deposit up to $10,000 and trade with enhanced capital.
- Leverage up to 1:3000: Maximizing potential profits with one of the highest leverage options available.
- ‘Best Customer Service Broker Asia’ Award: Recognized excellence in customer support and service.
- Seasonal Promotions: Enjoy a variety of exclusive bonuses and promotional offers all year round.
>> Sign Up for FBS Broker Account here <<
Click here below to download:


