


Supply and Demand Forex Trading Strategy
Supply and Demand… this is a basic economic term, which denotes availability of sellers willing to sell and buyers willing to buy. Having said that, supply and demand are important factors of price movement. In fact, both supply and demand are regulating factors for price, and at the same time price regulates supply and demand.
Given that trading is all about price movement, the concepts of supply and demand should be incorporated in forex trading.
Although no physical goods or services are exchanged in forex trading, the unit that is being exchanged is the currency pair itself. For example, how much Japanese Yen are you willing to exchange for a US Dollar? In the banking world, these are the questions that are being asked. Questions that drive the movement of foreign exchange rates. Questions that affect us as forex traders.
However, given that in forex there are no goods being exchanged in a physical market, no auction floors accepting bids, and no open outcry of bids and offers on a trading floor, it is quite difficult to assess at what price supply and demand is strongest. It is as if everybody wants to trade, but no one knows exactly at what price other traders are willing to buy or sell. What we can do however is speculate. Anyway, that is what we do as traders.
Supply and Demand on a Forex Chart
So, how do we speculate where supply or demand is strongest? It is based on the concept of price rallies and drops. Many supply and demand forex traders have coined these movements as rally-base-rally, drop-base-drop, drop-base-rally, or rally-base-drop. However, we will not delve into that as this would take too long for an article.
The basic concept is that a rally is an area in the chart where price strongly took off from going up, while a drop is an area in the forex chart where price strongly dropped from.
Many supply and demand traders speculate that this is due to the pending orders placed by institutional traders, which makes sense cause if there is someone who could strongly affect price, it would be the institutional traders. Some traders even go further and speculate that some of these pending orders are not filled due to the sheer volume of transactions in that area. Because of this, these traders also place their pending orders in that area, speculating that price would again rally or drop if price reaches that area because of the remaining unfilled pending orders.
Here is an example of a drop in price, indicating that there is a supply of pending orders in that area.
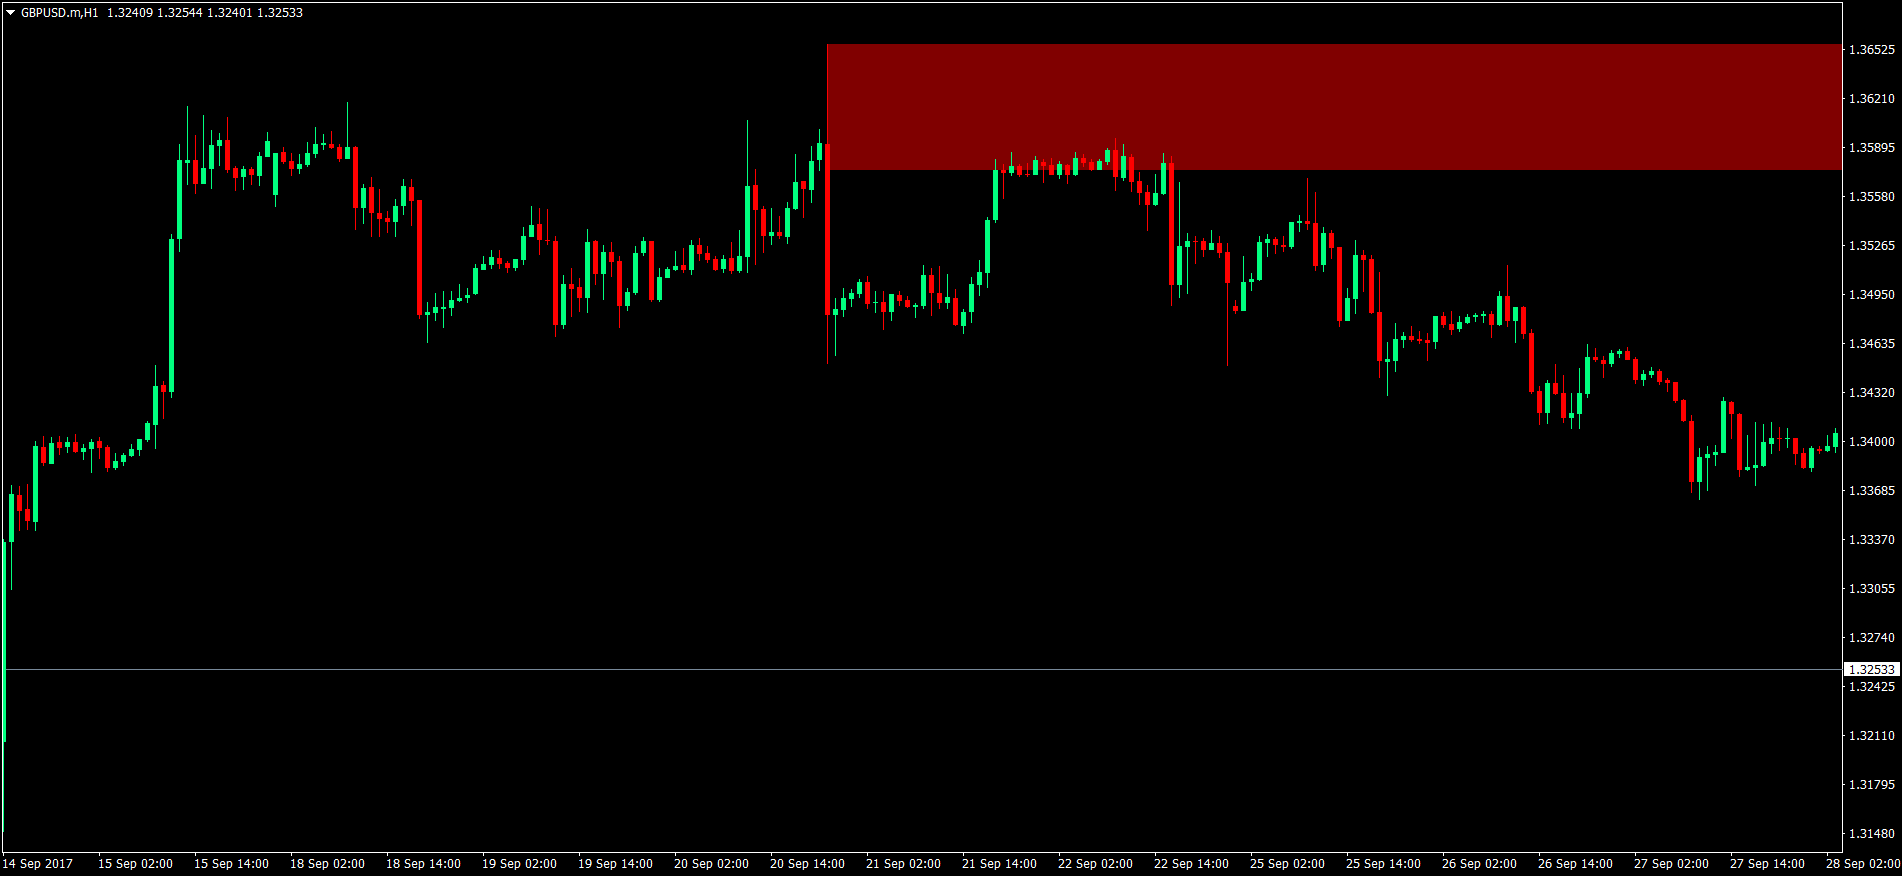
Notice how price strongly dropped from that area creating a long bearish candle.
And here is an example of a rally, indicating demand.
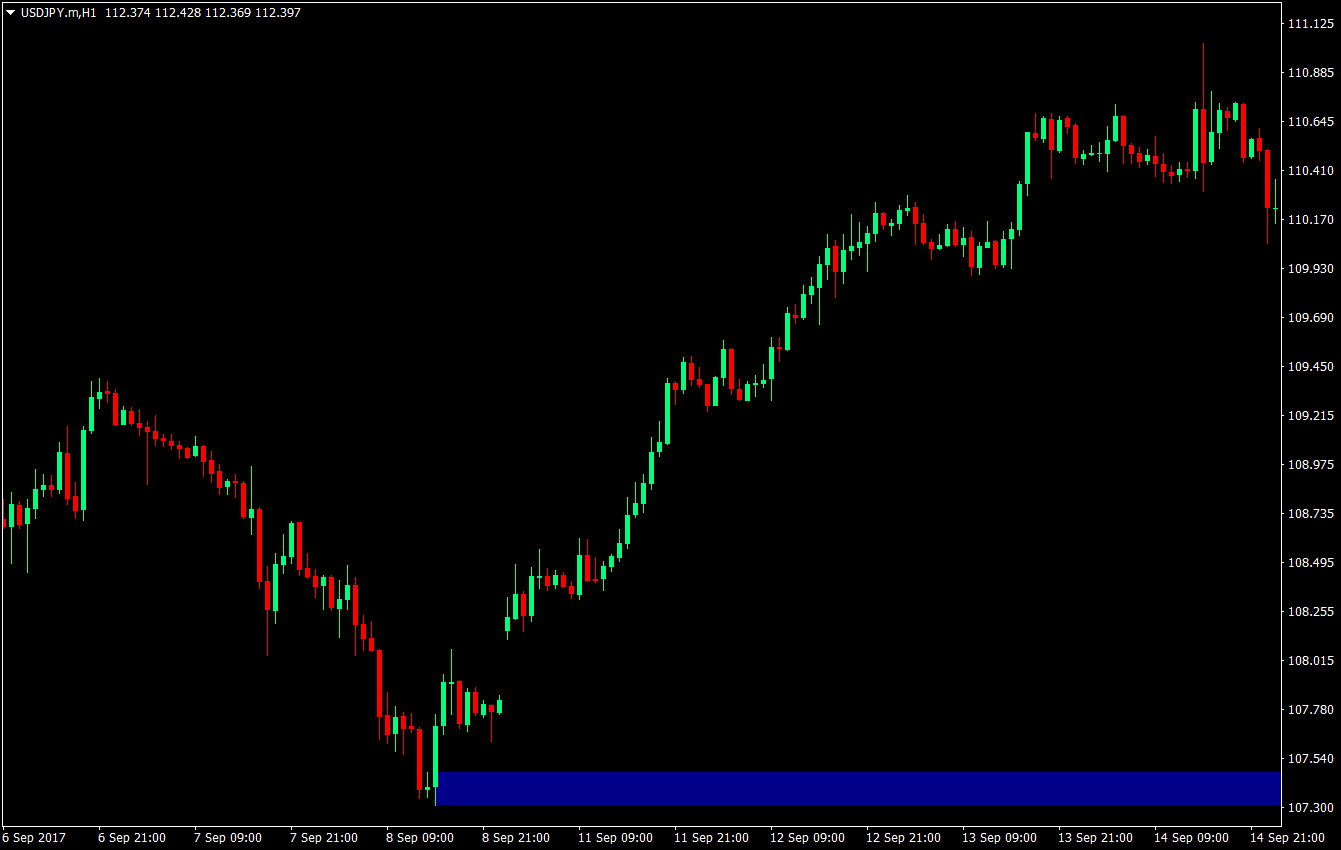
Again, a long bullish candle, indicating demand.
The Buy Setup – Entries, Exits & Stop Losses
To simplify this strategy, we will be using a Supply and Demand indicator, which conveniently plots these probable supply and demand areas.
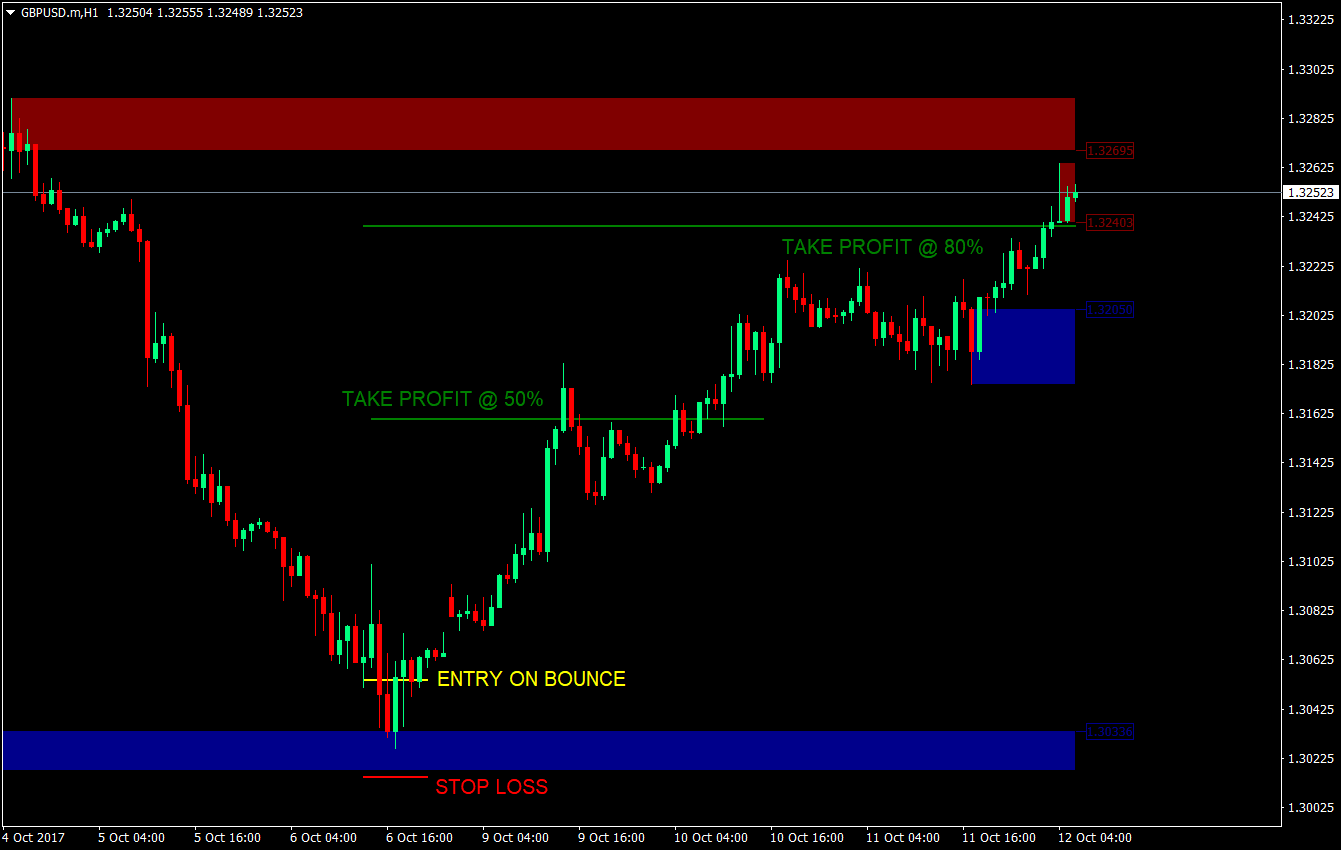
Buy Entry: To enter a buy setup, we must observe price as it touches the nearest fresh demand area drawn as a blue rectangle by the indicator. As soon as price touches the area, the next candle should bounce off the blue rectangle, indicating that price will rally back up.
Stop Loss: The stop loss should be just a few pips below the blue rectangle.
Take Profit 1: The take profit for the first half of the position should be the 50% line in between the demand area (blue rectangle) and the nearest supply area (red rectangle).
Take Profit 2: The take profit for the remaining half of the position should be the 80% line between the demand area (blue rectangle) and the nearest supply area (red rectangle).
Trailing Stop: As soon as the first take profit target is hit, the stop loss should be trailed to breakeven plus a few pips.
The Sell Setup – Entries, Exits & Stop Losses
Sell Entry: To enter a buy setup, we must observe price as it touches the nearest fresh supply area drawn as a red rectangle by the indicator. As soon as price touches the area, the next candle should bounce off the red rectangle, indicating that price will drop down.
Stop Loss: The stop loss should be just a few pips above the red rectangle.
Take Profit 1: The take profit for the first half of the position should be the 50% line in between the supply area (red rectangle) and the nearest demand area (blue rectangle).
Take Profit 2: The take profit for the remaining half of the position should be the 80% line between the supply area (red rectangle) and the nearest demand area (blue rectangle).
Trailing Stop: As soon as the first take profit target is hit, the stop loss should be trailed to breakeven plus a few pips.
Conclusion
The Supply and Demand strategy is one of the most logically sound strategies available out there. It is based on an economic theory, which is smartly incorporated in forex trading. In fact, there are several supply and demand trading gurus out there with proven track records of how supply and demand strategies work.
However, even if you could correctly identify the supply and demand areas, it doesn’t necessarily mean that there are still some pending orders left on that area that would cause price to bounce off. It all boils down to probabilities and trading edges. This strategy for sure does have a strong trading edge, based on the historical data of those who use this strategy.
Another setback of supply and demand, is that it takes time to master. It should take around a year to master identifying valid supply and demand areas. The good thing with this though is that this technical indicator could assist in identifying supply and demand areas. Basic knowledge of drawing supply and demand areas would still be good, as indicators are still not perfect.
Overall, this strategy is a winner because of its proven trading edge.
Recommended MT4 Broker
- Free $50 To Start Trading Instantly! (Withdrawable Profit)
- Deposit Bonus up to $5,000
- Unlimited Loyalty Program
- Award Winning Forex Broker
- Additional Exclusive Bonuses Throughout The Year

>> Claim Your $50 Bonus Here <<
Click here below to download:
awesome strategies
Hello Mr Morris. I would like to know that the supply and demand strategy does it work on day trading and on timeframes of 1m 5m 15m 30m and 1h. It’s a awesome strategy.
Hey there. This is a fabulous indicator. What would it take to convert this for MT5? The prop firm I’m with only uses MT5. I’m running this indicator on a MT4 demo account and then manually copying trades into MT5. It would be great to have it for MT5. I’ve studied smart money concepts for quite a while, but still wrestle with seeing the order blocks. I’ve used this indicator on a demo account for the past two weeks. Just closed a $2K trade with several others close to fully closing. ONLY 1hr and 4hr though. I tried lower timeframes and it wasn’t nearly as reliable for me. Thank you for this indicator!