


“Trade with the trend!” This thought has been repeated again and again by many professional and profitable traders and for good reasons. Trading with the trend allows traders to trade with high accuracy because trade direction is usually already a given.
However, many traders still find it difficult to profit from a trending market condition. Many traders just cannot seem to find a means to trade in the direction of a clearly trending market. Many traders second guess themselves thinking that they might be entering the trend too late. What these traders need is a systematic method to enter a market that is already trending.
In this strategy we will be exploring techniques to enter a trending market using the concept of a dynamic support or resistance area and how price would usually bounce off such areas after a slight retracement towards it.
Dynamic supports and resistances are basically areas of support or resistance which are based on a dynamic technical indicator. These indicators could be moving averages, Bollinger Bands, etc. Any technical indicator which price action tends to respect as a support or resistance line can be considered as a dynamic support or resistance.
Here, we will be looking at how the Kijun-sen line can be used as a basis for a dynamic support or resistance line.
Kijun-sen +
The Kijun-sen is an integral component of the Ichimoku Kinko Hyo indicator, which is one of the few indicators that could claim to be a complete system by itself.
The Ichimoku Kinko Hyo indicator is composed of the Tenkan-sen, Kijun-sen, Senkou Span A, Senkou Span B and the Chikou span. All these lines represent different trends, from the short-term trend to the long-term trend, mostly based on the median of a preset price range or a variation thereof.
Kijun-sen represents a somewhat short- to mid-term trend which is usually the basis for entry signals. Paired with the Tenkan-sen and traded in the direction of the long-term trend as indicated by the Senkou Span A and B lines, the signals that are produced by this system tends to be very accurate.
Kijun-sen + eliminates all the other lines on the Ichimoku Kinko Hyo indicator. It also modifies the Kijun-sen line to plot two lines that interact with each other. The faster line is color red while the slower line is color blue.
The market is considered bullish if the red line is above the blue line, and vice versa if the lines are stacked inversely. Traders can also use the crossover of the two lines to indicate a trend reversal.
Awesome Oscillator
The Awesome Oscillator (AO) is a trend following technical indicator used to identify and measure market momentum. It is based on the crossover of an underlying pair of moving average lines.
The AO calculates for the difference between a 5-period Simple Moving Average (SMA) line and a 34-period Simple Moving Average (SMA) line. The computation however is based on the midpoints of each bar instead of the close of each candle, which are usually the basis for other indicators.
The indicator then plots the difference between the two lines as a histogram bar. The color of the bars also changes to indicate the strengthening or weakening of a trend.
Positive green bars indicate a strengthening bullish trend, while positive red bars indicate a weakening bullish trend. Negative red bars on the other hand indicate a strengthening bearish trend, while negative green bars indicate a weakening bearish trend.
Given the nature of the AO, it could be assumed that it identifies trend direction based on the crossover of moving average lines, except that it is plotted as histogram bars.
Traders can use the shifting of the bars over zero as a trend reversal signal. Traders can also use the indicator to filter out trade setups that do not conform to the direction of the trend.
Trading Strategy
Kijun Dynamic Area Entry Forex Trading Strategy is a trend following strategy which makes use of the Kijun-sen + indicator as a dynamic area of support and resistance.
To trade this strategy, first we must identify the trend.
Trend direction is confirmed using the 30-period Exponential Moving Average (EMA) and 100-period Exponential Moving Average (EMA) lines. Trend direction is based on how the two lines overlap. The two lines should also slope in the direction of the trend.
Trending markets would usually be very obvious to seasoned traders based on how price action is sloping up or down.
The AO is also used to confirm trend direction. Trend direction is confirmed based on whether the AO bars are staying above or below zero.
As soon as the trend is confirmed, we then wait for price to retrace towards the area below the Kijun-sen + lines.
Trade entry is confirmed as soon as price closes back above the Kijun-sen + lines while the red line is stacked against the blue line in the direction of the trend.
Indicators:
- Moving Average
- Period: 30
- MA Method: Exponential
- Color: Green
- Moving Average
- Period: 100
- MA Method: Exponential
- Color: Saddle Brown
- KijunTenkan+
- Awesome
Preferred Time Frames: 1-hour and 4-hour charts
Currency Pairs: FX majors, minors and crosses
Trading Sessions: Tokyo, London and New York sessions
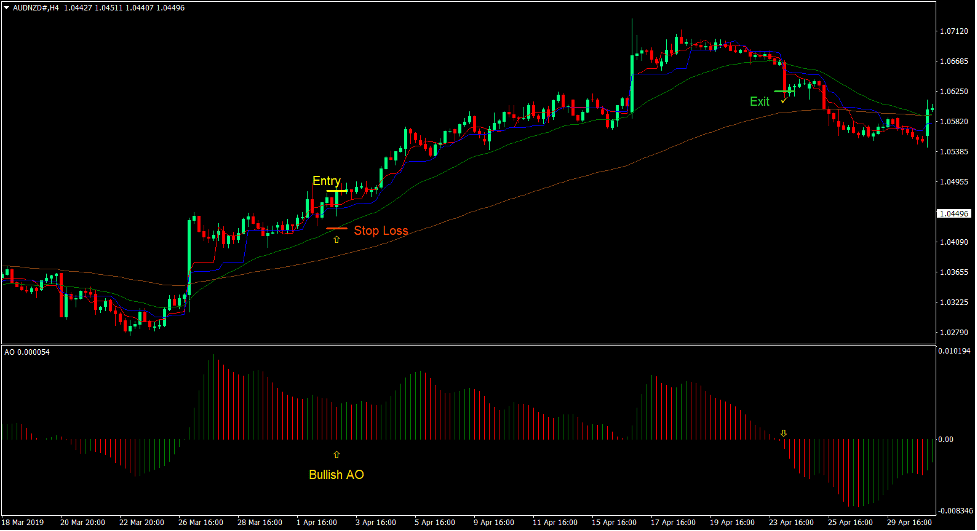
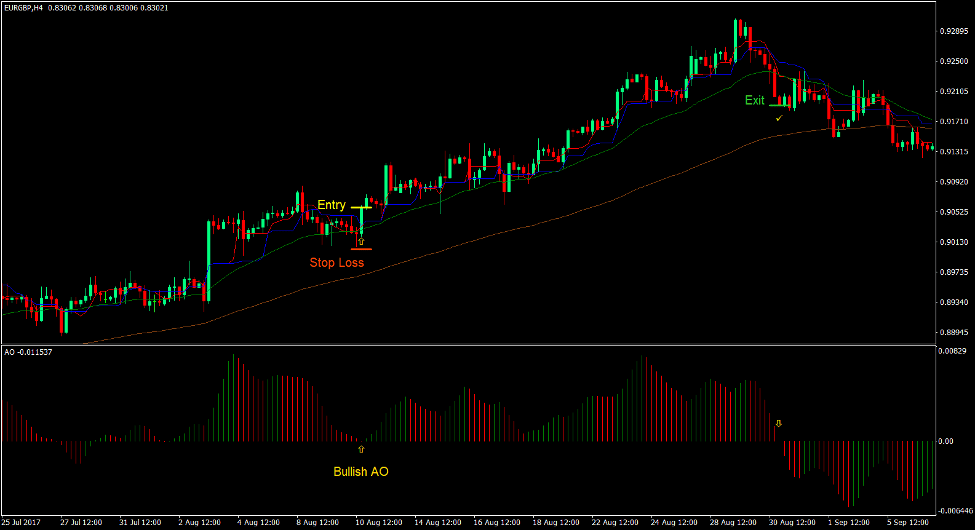
Buy Trade Setup
Entry
- The 30 EMA line should be above the 100 EMA line.
- Both EMA lines should slope up.
- Price action should be in an uptrend.
- The AO bars should be positive.
- Price should retrace towards the area of the Kijun-sen + lines.
- The red Kijun-sen + line should be above the blue line.
- Enter a buy order as soon as price closes above the Kijun-sen + lines.
Stop Loss
- Set the stop loss on a support below the entry candle.
Exit
- Close the trade as soon as the AO bars shift below zero.
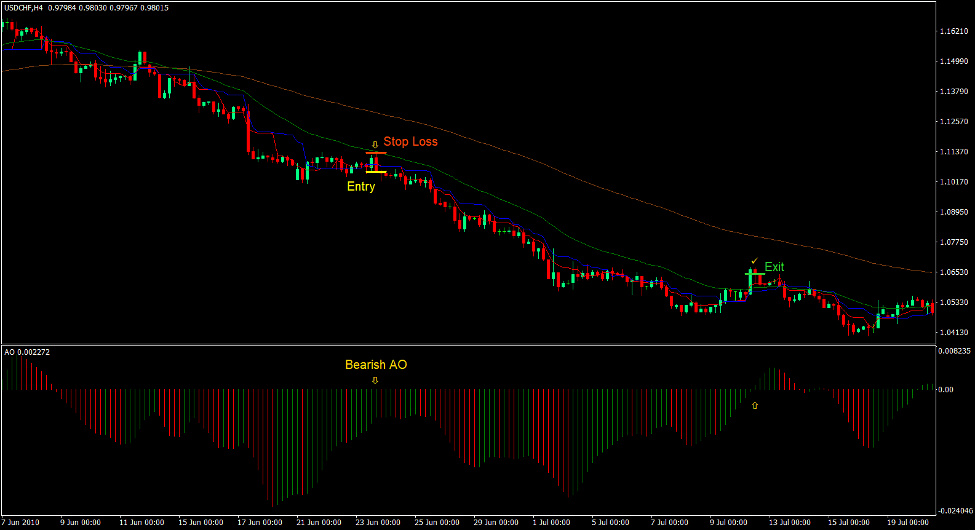
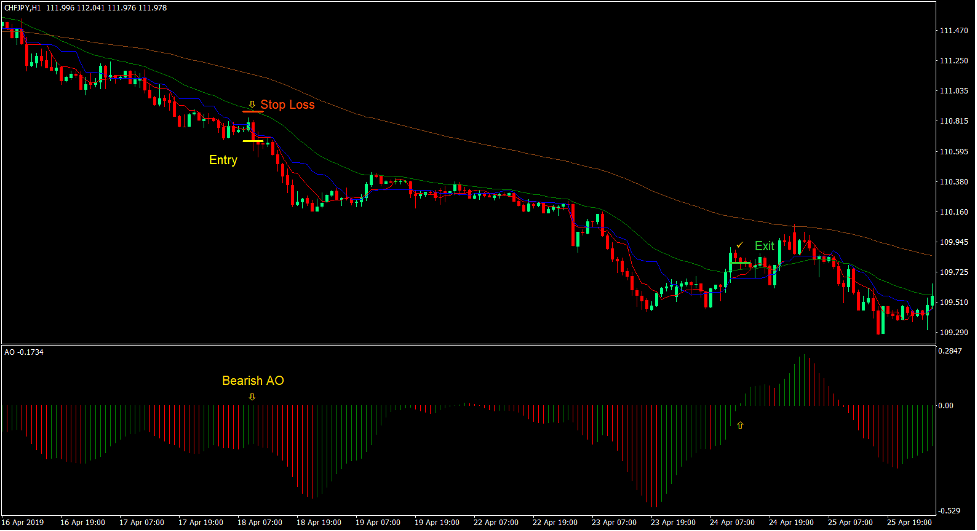
Sell Trade Setup
Entry
- The 30 EMA line should be below the 100 EMA line.
- Both EMA lines should slope down.
- Price action should be in a downtrend.
- The AO bars should be negative.
- Price should retrace towards the area of the Kijun-sen + lines.
- The red Kijun-sen + line should be below the blue line.
- Enter a sell order as soon as price closes below the Kijun-sen + lines.
Stop Loss
- Set the stop loss on a resistance above the entry candle.
Exit
- Close the trade as soon as the AO bars shift above zero.
Conclusion
Many traders do not make money in a trending market environment because they have no system to trade it. This strategy simply provides a simple yet logical trading method which traders can use to trade a trending market.
Traders can use it to enter a market when it is already trending yet not try to chase price.
The key to trading this strategy successfully is in finding the right trending market which has a clear slope and tends to respect the dynamic support or resistance area near the Kijun-sen + lines.
Recommended MT4 Brokers
XM Broker
- Free $50 To Start Trading Instantly! (Withdraw-able Profit)
- Deposit Bonus up to $5,000
- Unlimited Loyalty Program
- Award Winning Forex Broker
- Additional Exclusive Bonuses Throughout The Year

>> Sign Up for XM Broker Account here <<
FBS Broker
- Trade 100 Bonus: Free $100 to kickstart your trading journey!
- 100% Deposit Bonus: Double your deposit up to $10,000 and trade with enhanced capital.
- Leverage up to 1:3000: Maximizing potential profits with one of the highest leverage options available.
- ‘Best Customer Service Broker Asia’ Award: Recognized excellence in customer support and service.
- Seasonal Promotions: Enjoy a variety of exclusive bonuses and promotional offers all year round.

>> Sign Up for FBS Broker Account here <<
Click here below to download: