


“Buy low and sell high…” or “Sell high and buy low.” This is the whole concept behind trading. Simple, isn’t it? Traders who can master this simple art of buying low and selling high or selling high then buying low are the ones who make money out of the forex market. The bigger the difference between the two, the higher the yields on a trade.
This is what trend reversal traders live by. Trend reversal traders attempt to trade on the bottom of a downtrend and exit as the market peaks. They would also short the market at the peak of an uptrend and sell the security at the bottom of the trend reversal.
Trend reversal trading is a high yield type of strategy. Trades that are managed well could gain multiples in a single trade. If the trend lasts long enough, traders stand to gain more pips than they could ever imagine.
However, picking tops and bottoms is quite difficult. Trades are often taken against the momentum of the current trend. For this reason, many trend reversal traders are willing to forgo accuracy for the prospect of gaining high yields. Many trend reversal trading accounts are characterized by high reward-risk ratios and low win rates.
If you are the type of trader who is willing to take small losses hear and there for the prospect of winning it big down the road, then this strategy could be for you.
Ichimoku Cloud Envelope Forex Trading Strategy is a trend reversal trading strategy that trades on indications of trend reversals based on the Kijun-sen Envelope and the MACD. This combination of mid- and long-term momentum indicators provide trade setups that could result in long-term trends.
Kijun-sen Envelope
The Kijun-sen line is a component of the Ichimoku Kinko Hyo or Ichimoku Cloud indicator. Also called as the Base Line, the Kijun-sen line represents the mid-term trend on the Ichimoku Kinko Hyo indicator.
Kijun-sen Envelope is a trend following indicator developed based on the classic Kijun-sen line.
It is an envelope indicator which is composed of three lines. The midline is the classic Kijun-sen line. The top and bottom lines are the outer bands. These lines are derived from Kijun-sen line. The top and bottom lines have deviations of +300 and -300 pips from the Kijun-sen line. Traders could also modify the deviation from the Kijun-sen line based on their strategy.
Traders could use the crossover of price and the Kijun-sen line as an indication of a probable trend reversal. It could also act as a dynamic support or resistance. It all depends on how price responds as price touches the line. Price rejection could indicate that it is acting as a dynamic support or resistance, while a strong momentum crossover could indicate a probable trend reversal.
MACD Color
MACD Color is a trend-following indicator based on the classic Moving Average Convergence and Divergence (MACD).
This indicator is an oscillator displayed with a line and histogram bars. The histogram bars is computed by the difference between two moving average lines. The line on the other hand is a Simple Moving Average (SMA) derived from the histogram bars.
There are several ways to trade this indicator. Trade signals could be generated as the line and histogram bars crossover. Because the line and the bars tend to reverse back to the midline, it is best to take bullish trades when both the line and the bars are negative, and bearish trades if both are above zero.
Trades could also be generated as the line or the histogram bars crosses over the midline. This would be like taking crossover trades indicating a possible trend reversal since the histogram bar is based on the difference of two moving averages.
Trading Strategy
This trading strategy generates trend reversal setups on the confluence of trend reversal signals coming from the two indicators.
On the Kijun-sen Envelope indicator, price should crossover and close on the opposite side of the mid line. However, not all crossovers would mean a trend reversal. It would also be best to observe for price action. Price rejection of the outer bands prior to the crossover could indicate a trend reversal. A big long candle with small wicks crossing over the line would also indicate a strong momentum that could push a trend reversal.
On the MACD Color indicator, trend reversal signals will be based on the crossover of the histogram bars over zero. A bullish signal should be indicated by green bars, while a bearish signal should be indicated by red bars.
Indicators:
- kijun_sen_and_envelope (default setting)
- ZZ_YZ_MDAC_ELDER_1-1000 (default setting)
Preferred Time Frames: 30-minute and 1-hour charts
Currency Pairs: major and minor pairs
Trading Sessions: Tokyo, London and New York sessions
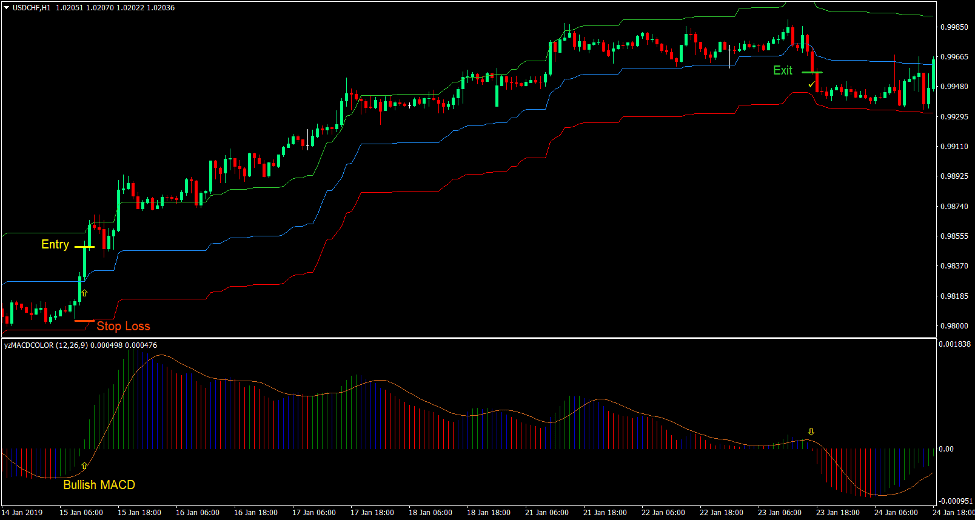
Buy Trade Setup
Entry
- Price should cross strongly above the midline of the Kijun-sen Envelope.
- The MACD Color histogram bars should cross above zero.
- These bullish signals should be aligned.
- Enter a buy order on the confirmation of these conditions.
Stop Loss
- Set the stop loss on the fractal below the entry candle.
Exit
- Close the trade as soon as a MACD Color histogram bar crosses below zero.
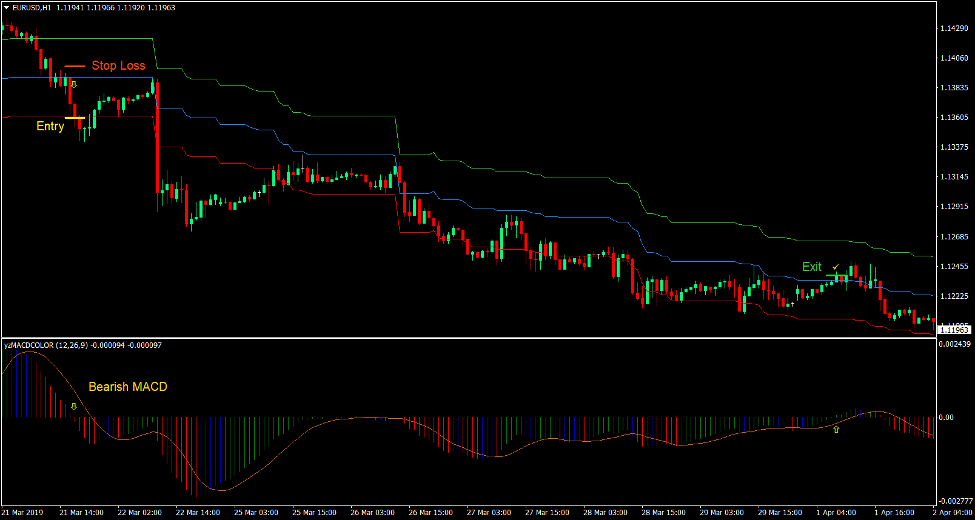
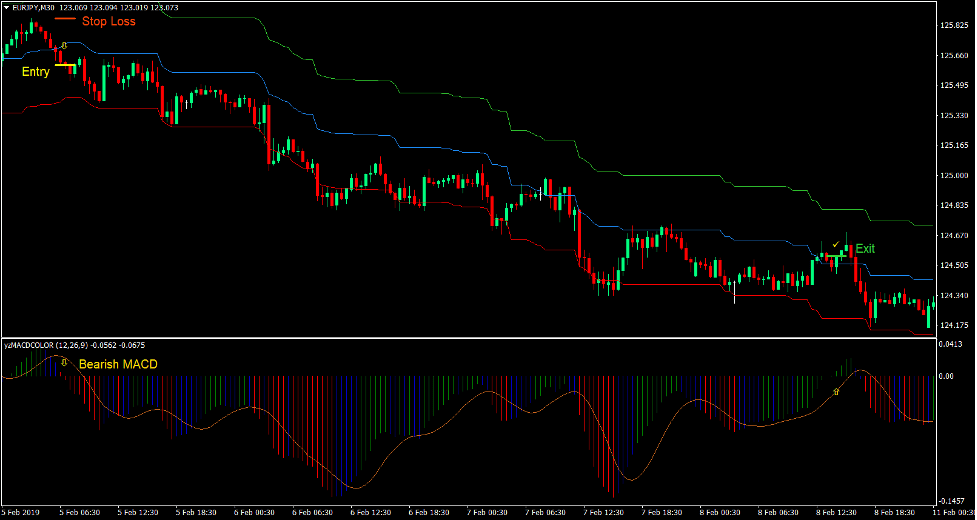
Sell Trade Setup
Entry
- Price should cross strongly below the midline of the Kijun-sen Envelope.
- The MACD Color histogram bars should cross below zero.
- These bearish signals should be aligned.
- Enter a sell order on the confirmation of these conditions.
Stop Loss
- Set the stop loss on the fractal above the entry candle.
Exit
- Close the trade as soon as a MACD Color histogram bar crosses above zero.
Conclusion
This trend reversal strategy is one which earns profits coming from high yielding trades at the expense of small losing trades.
The key to trading this strategy properly is by using it as a confirmation of a trend reversal trade setup. Traders could zoom out of the chart in order to see the trend in the bigger picture. If price action indicates that a trend reversal is probable, then this strategy could be used to confirm such trend reversal.
Trading this strategy requires excellent trade management skills as there are occasions when price could reverse sharply. Stop losses should be trailed at an appropriate distance in order to protect profits.
Recommended MT4 Brokers
XM Broker
- Free $50 To Start Trading Instantly! (Withdraw-able Profit)
- Deposit Bonus up to $5,000
- Unlimited Loyalty Program
- Award Winning Forex Broker
- Additional Exclusive Bonuses Throughout The Year

>> Sign Up for XM Broker Account here <<
FBS Broker
- Trade 100 Bonus: Free $100 to kickstart your trading journey!
- 100% Deposit Bonus: Double your deposit up to $10,000 and trade with enhanced capital.
- Leverage up to 1:3000: Maximizing potential profits with one of the highest leverage options available.
- ‘Best Customer Service Broker Asia’ Award: Recognized excellence in customer support and service.
- Seasonal Promotions: Enjoy a variety of exclusive bonuses and promotional offers all year round.

>> Sign Up for FBS Broker Account here <<
Click here below to download: