


Forex Trend line Strategy Introduction
Trend line can do 2 in 1 package for you. Yes, you don’t even need to use other technical analysis nor indicators to trade unless you feel uncertainty at that time.
If you think that trend line is useless, then I want you rethink again. Trend line is one of big boy traders do.
Anyway, here is what trend line can do for you:
- Trend lines can help you to find good entry point
- Trend lines can help you to find the appropriate stop loss
The concept of trend line is the same as support and resistance but trend line is more unique in my opinion. You just need to connect two swing points, then you just made your own trend line.
How to Create a Trend Line
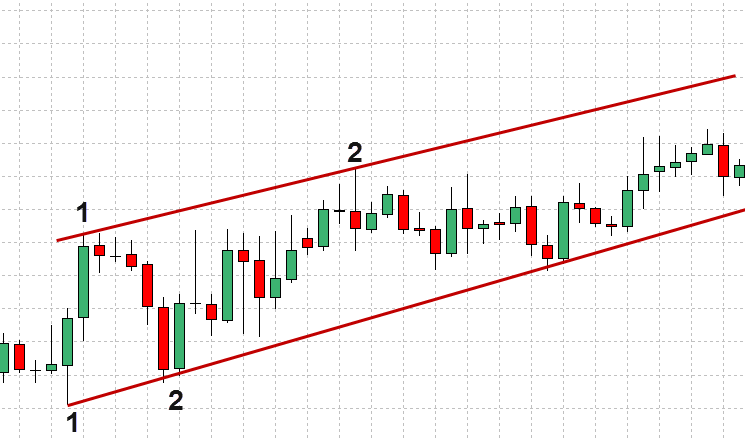
For creating an uptrend trend line, connect two points of tops.
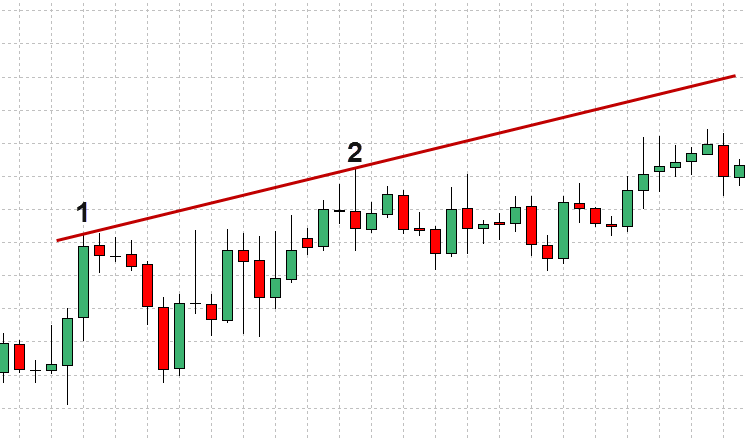
For creating a downtrend trend line, connect two points of bottoms.
Simple?
Yes, it is…
The Forex Trend Line Trading Method:
Let me outline the steps for this method:
- Identify the trend
- Switch from the big timeframe to lower timeframe
- Create a trend line
- Set entry, stop loss and target
Step 1: Identify the trend
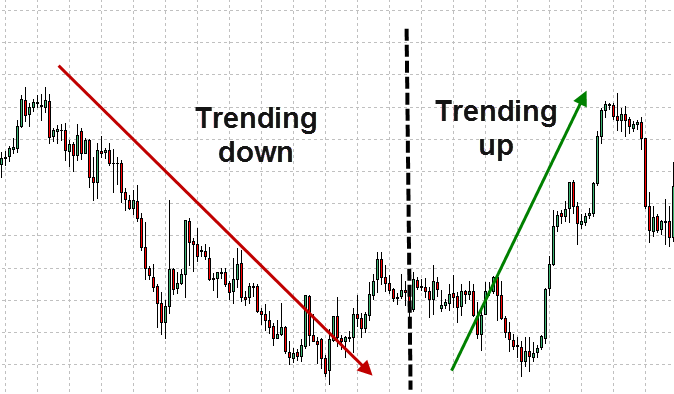
We want to see the market is either trending down or up.
Open your chart and set a 150 exponential moving average.
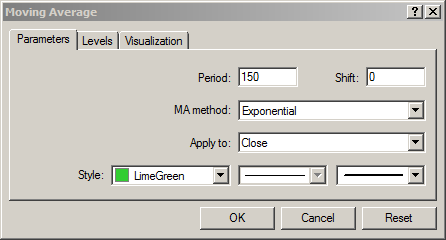
Remember, trend line works best when the market is trending. If the trend is consolidate, then steps aside for a while.
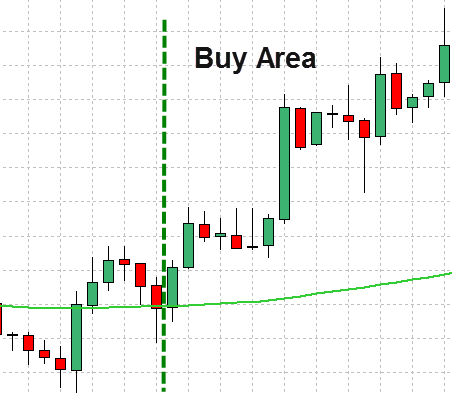
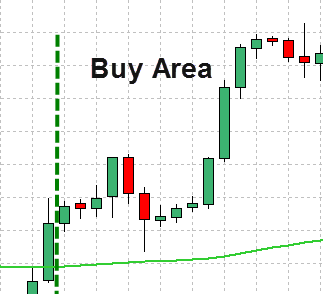
Trending Up
If the trend is up, we’re only looking for buy
Example 1:
Example 2
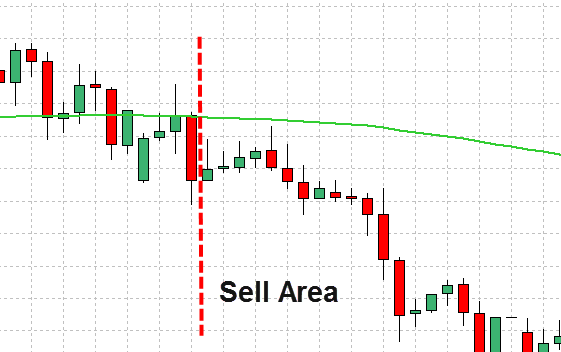
Trending down
If the trend is down, we’re only looking for sell.
Example 1:
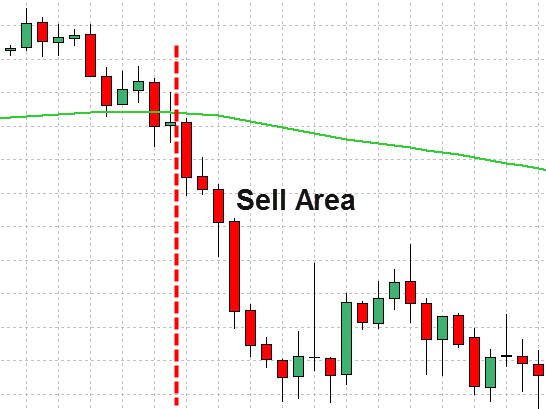
Example 2:
Step 2: Switch to lower timeframe
If the timeframe that you use for the previous step is daily, then switch over to 4hr or 1hr.
If it is 4hr timeframe, then switch it to 1hr or 30min timeframe.
Why do we need to switch over the timeframe??
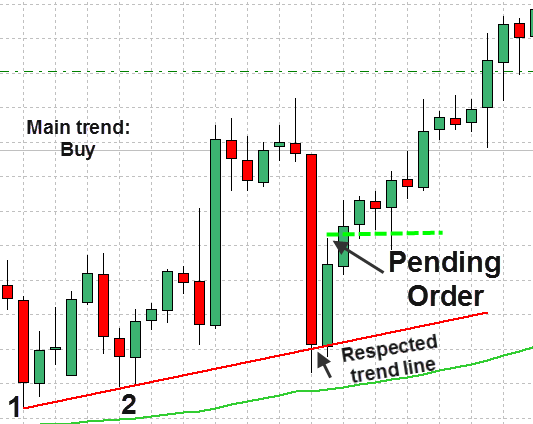
Refer to the chart below. Once we’ve already identify main trend (sell) from the main timeframe (daily), then switch over to smaller one (4 hour) to look for signals that follow the direction of the trend (sell signal only).
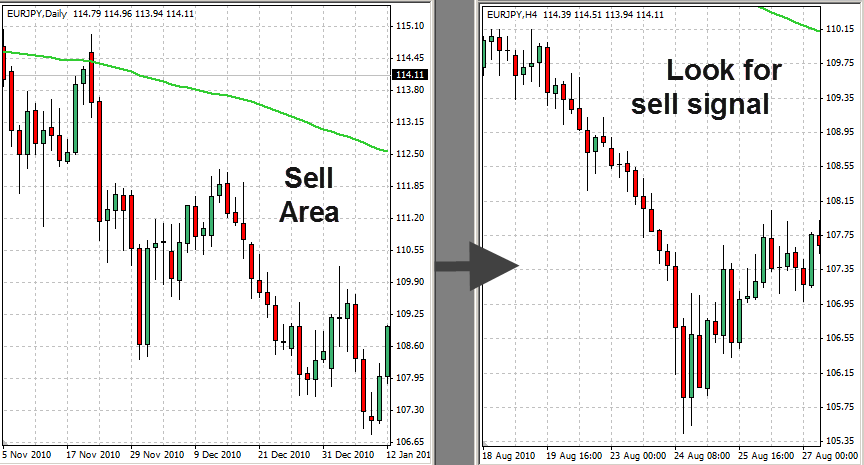
The signal comes from the trend line itself which we’ll learn in the next two steps.
Step 3: Create a trend line/trend lines
Implement what you’ve learned in the introduction section.
Step 4: Entry Point
So when you’ll make an entry?
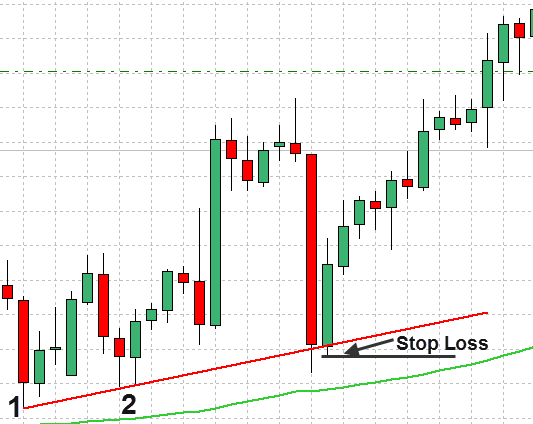
Set a pending order on the high or low of the candlestick that closed and approach the trend line.
Buy Entry:
When the candlestick closed and respect/approached the trend line, then set pending order on or 1 pip higher of the highs of that candlestick.
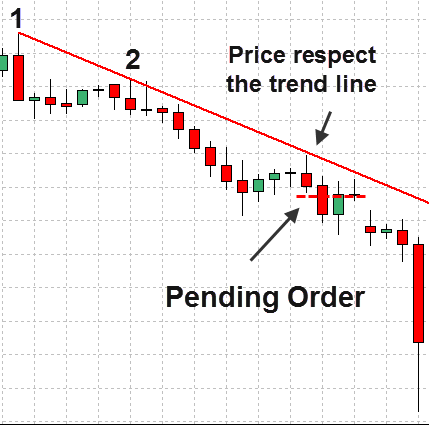
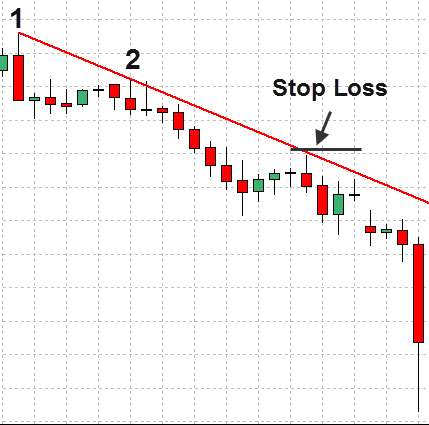
Sell Entry:
When the candlestick closed and respect/approached the trend line, then set pending order on or 1 pip higher of the lows of that candlestick.
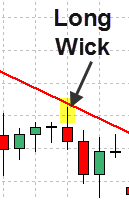
Tips: If a candlestick close with a long wick on the trend line, then it indicates strong rejection and likely will create an impact to the market.
Stop loss:
For buy: Set the stop loss below the candlestick.
For sell: Set the stop loss above the candlestick.
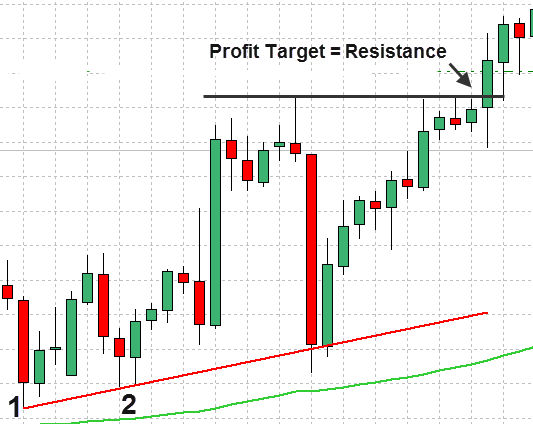
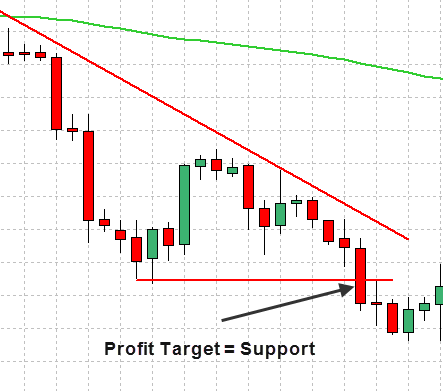
Profit Target:
For buy: target the previous resistance.
For sell: target the previous support
The Tips: Further confirmation
#1 – Combine the trend line strategy with candlestick patterns.
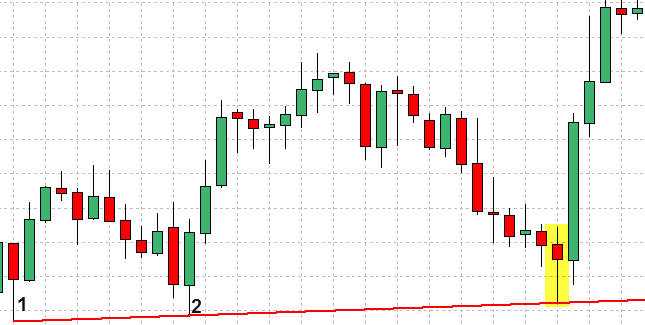
The yellow highlight on the chart shows a pin bar pattern. It is one of the candlestick pattern that indicates a reversal. Notice the price bounce back up tremendously.
#2 – Combine the trend line strategy with indicators
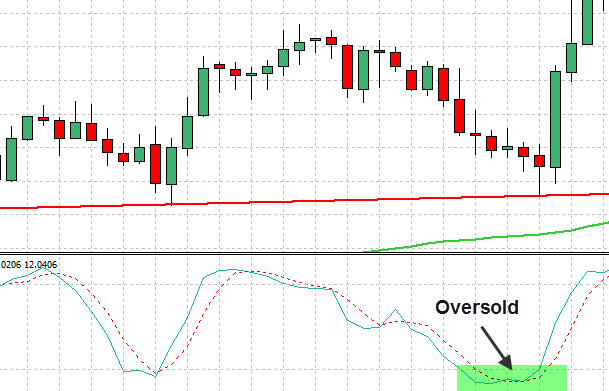
The Stochastic indicator line was at the oversold area. Oversold area indicates weakness of selling.
The Forex Trend Line Strategy Method In A Nutshell:
So, let me copy whole important outline of what you’ll be doing with this method:
- Identify the trend
- Switch from the big timeframe to lower timeframe
- Create a trend line
- Set entry, stop loss and target
- Optional: Increase trading confirmation with – Candlestick Pattern, – Indicator
I hope you enjoyed reading this short, simple, forex strategy post on an easy way to dominate trend lines!
I got this Free Report for you on “How You Can Understand the Forex Market Trend & Pattern!”

You will also learn how to identify Uptrend or Downtrend and even provides early signs of reversals. You will like this!
Best regards,
Tim Morris
Great Stuff!!
What are your stoch settings?
Thanks
Hi Jason,
The settings on the Stochastic Oscillator depend on personal preferences, trading style, and timeframe. We are using the default: 80 as the overbought threshold and 20 as the oversold threshold.
Also, for the profit target, do you use the resistance from higher time-frame or entry(1hour)?
Do check the lower and higher timeframe chart for resistance. This will helps.