


Band Bounce Forex Trading Strategy
Trading with the trend is one of the easiest ways to make money out of the forex market. This is true not only to forex but also to all other trading instruments, whether it be penny stock trading, index trading, binary options, commodities, etc. This is common knowledge among many traders. You would often hear the trading adage, “Trade with the trend.” But even though most traders know this, many are at a loss when determining the direction of a trend.
Exponential Moving Average (EMA) Band Trend Trading
Moving averages are one of the best ways to determine trend. The concept behind it is simple and logical. Get the average of the recent historical price closes then compare the current price to the average. If the current price is higher, then we have an uptrend, if the price is lower, then we have a downtrend. This concept is commonly used with the 50 and 200-period Exponential Moving Average (EMA).
Although this concept works, there are times when the short-term, mid-term, and long-term trend don’t agree. Price could be below the 50 EMA but above the 200 EMA. What then? What direction should we take?
There is another way to determine trend using EMAs. This is by using multiple EMAs. You would sometimes see traders having a band of moving averages on their chart. This is basically what they are doing. They are determining the trend by the position of the moving averages in relation to another moving average with a different period.
For example, we could have a 25, 60 and 100-period EMA, all of which are commonly used. Then we could determine a trend if the three EMAs are stacked and which direction they are going. If the fastest EMA is on top, in this case the 25, and the slowest is at the bottom, the 100, then we have a bullish market condition. If it is the reverse, then we have a bearish bias.
EMA Band Trading Strategy Concept
The concept behind this strategy is to use the EMA band as an indicator for trend direction. We will be using the EMAs we’ve used as an example above.
- 25 EMA: Gold
- 60 EMA: Green
- 100 EMA: Brown
If the 25 EMA is on top and the 100 EMA is at the bottom, then we will be taking buy trades. If the 25 EMA is at the bottom and the 100 EMA at the top, then we will be looking for sell setups. If the EMAs are not stacked, then we will not be taking a trade as the market might still be reversing and has not yet established a trend.
Then, for our entry, we will be looking to trade deep retracements against our trading direction. These deep retracements should be a short-term overextended market condition, ripe for a reversal and resumption of the main trend direction.
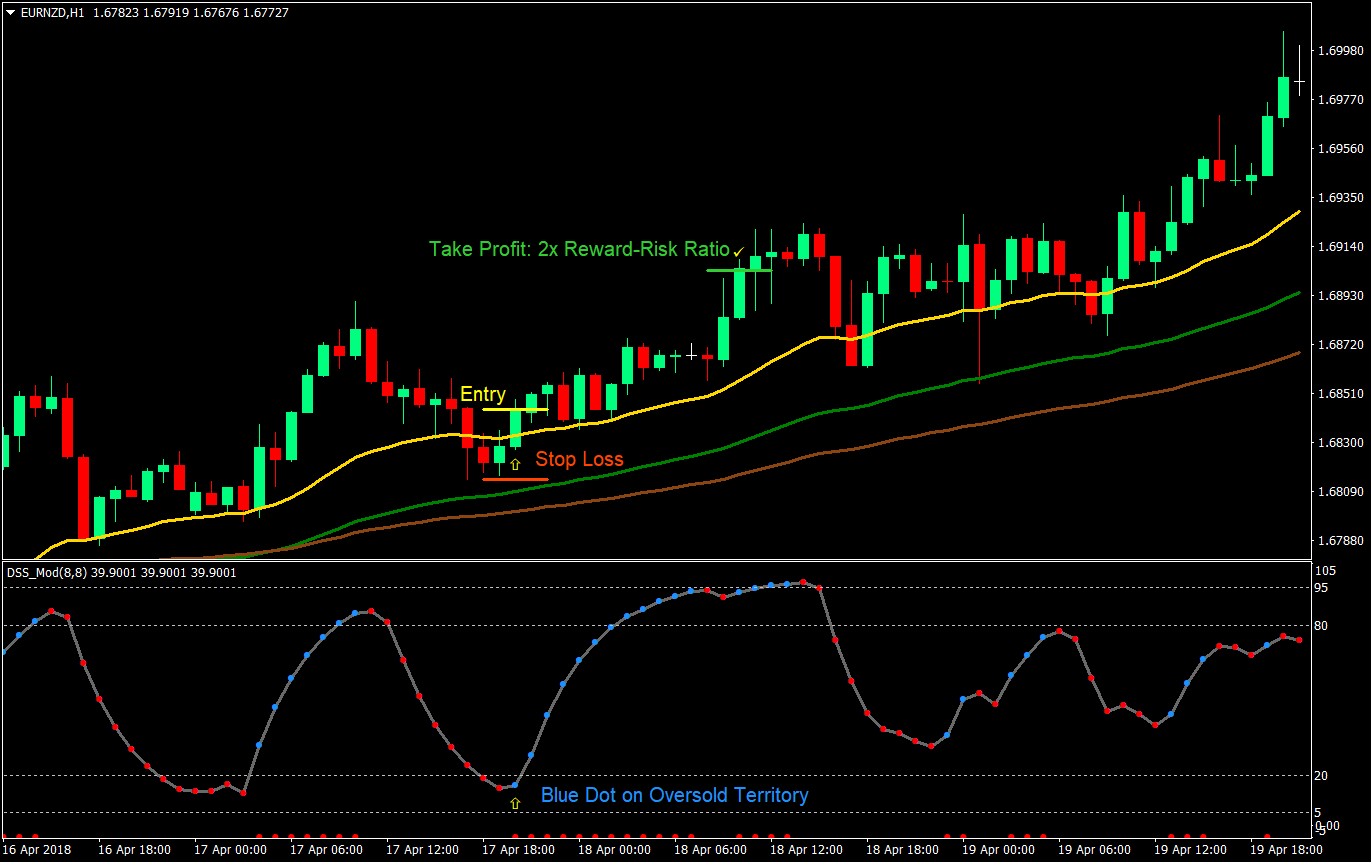
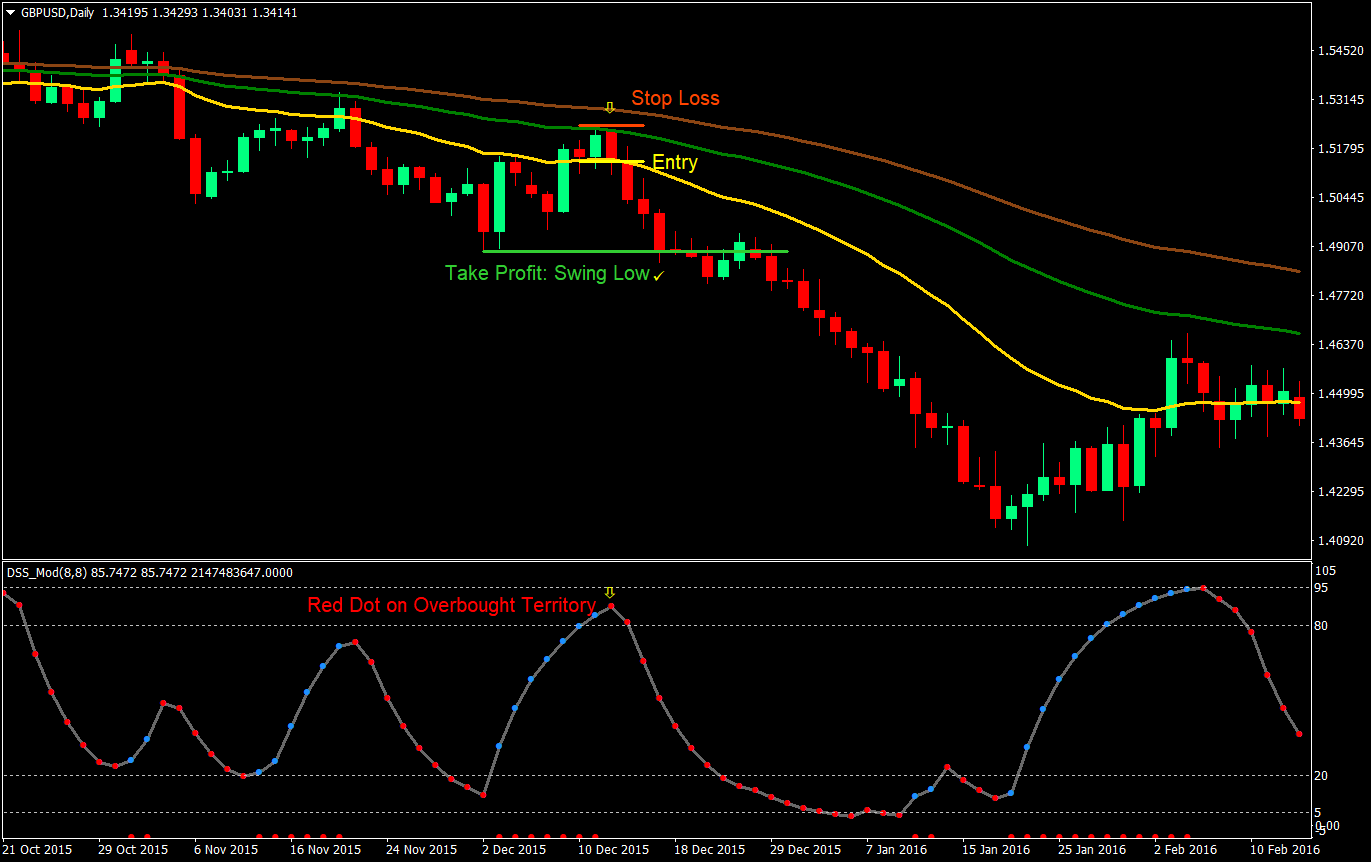
To determine if the market is on an overextended condition we will be using the Robby DSS custom indicator. This is a smooth oscillating indicator which determines turning points by plotting red and blue dots. It also conveniently has an oversold and overbought marker on the 20 and 80 line. Below the 20 would be considered an oversold market condition. Above the 80 would be an overbought market condition. To determine our entry points, we will be looking for color changes on these areas that agree with the direction of the EMA bands trend bias.
Indicators:
- 25 EMA: Gold
- 60 EMA: Green
- 100 EMA: Brown
- Robby DSS Forex
Timeframe: 1-hour, 4-hour, and daily charts
Currency Pair: any
Session: any
Buy (Long) Trade Setup Rules
Entry:
- The EMAs should be stacked
- 25 EMA – top
- 60 EMA – middle
- 100 EMA – bottom
- The Robby DSS should be on an oversold market condition
- Enter a buy market order on the close of the candle corresponding the color change of the Robby DSS indicator from red to blue
Stop Loss:
- Set the stop loss at the swing low below the entry candle
Take Profit:
- Option 1: Set the target take profit at 2x the risk on the stop loss
- Option 2: Set the target take profit at the high of the prior swing high
Sell (Short) Trade Setup Rules
Entry:
- The EMAs should be stacked
- 25 EMA – bottom
- 60 EMA – middle
- 100 EMA – top
- The Robby DSS should be on an overbough market condition
- Enter a buy market order on the close of the candle corresponding the color change of the Robby DSS indicator from blue to red
Stop Loss:
- Set the stop loss at the swing high above the entry candle
Take Profit:
- Option 1: Set the target take profit at 2x the risk on the stop loss
- Option 2: Set the target take profit at the low of the prior swing low

Conclusion
This is a strategy that would yield very high probability trade setups. Given that the trades taken would be in the direction of the general trend and the entries are based on short-term overextended market conditions, this would allow traders to enter the market at prime reversal conditions, which at the same time goes with the direction of the general trend.
With regards to the take profit targets, either of the two would be great and have their own advantages and disadvantages. Setting the target at twice risk would fix the reward-risk ratio to 2:1. Any ratio above 1:1 could be profitable in my books as long as the win-loss ratio is also positive. Also, there will be times when if the swing points are used as target take profits, the reward-risk ratio would be below 2:1. You could be leaving much on the table as these areas could often be surpassed since price usually makes new highs or lows on a trending market.
On the other hand, if the trade setup would allow for a tight stop loss, then we could have targets greater than 2:1. However, we shouldn’t just set targets in a whim. The logical target in this case would be the swing points, as these are also natural supports and resistances. Since we are trading trending markets exclusively, there is a high probability that the swing points would be surpassed, giving us a high probability trade.
The key point is to have a reward-risk ratio of 2:1 or higher.
Another exit strategy could be exiting on a trailing stop. This could either be to trail the stop loss a few candles back or to trail it based on fractals. Either could work. This would allow you to ride the whole short-term trend but could also cause reward-risk ratios to fluctuate above or below 2:1.
Test and tweak and you could have a good strategy on your hand.
Recommended MT4 Broker
- Free $50 To Start Trading Instantly! (Withdrawable Profit)
- Deposit Bonus up to $5,000
- Unlimited Loyalty Program
- Award Winning Forex Broker
- Additional Exclusive Bonuses Throughout The Year

>> Claim Your $50 Bonus Here <<
Click here below to download: