


If you have been into trading for quite some time, you would know that anything can happen in trading. The market may be trending in one direction and then suddenly reverse on the next candle. Price may be very stagnant and may be moving for only a few pips, then suddenly price would move with strong momentum in one direction.
Anything can happen in trading. Traders who think they could predict the market are just way over their heads. There is no way to predict what the collective thoughts of millions of traders and market participants are thinking. What traders have control of is their own actions.
Trading is all about probabilities. Although anything can happen in trading, certain conditions and patterns recur again and again with a high degree of probability. For example, momentum traders believe that price have a strong tendency to continue its direction after a strong momentum candle. Although this does not always follow, it does happen often. Traders who trade momentum could profit in the long run because of probabilities and the law of large numbers.
Awesome Oscillator Arrows Forex Trading Strategy is a strategy that aims to trade on high probability patterns and conditions based on confluence. Patterns and market characteristics that indicate a probable trending move are filtered based on the direction of the trend and an entry signal is generated based on momentum.
Awesome Oscillator
The Awesome Oscillator (AO) is a momentum indicator which is used to identify trend direction, strength and reversals.
This indicator is a simple indicator which is computed by plotting the difference between a 5-period Simple Moving Average (SMA) and a 34-period Simple Moving Average (SMA). However, this indicator is not based on the close of the candle. Instead, it is derived from the median of each candle within the period.
The Awesome Oscillator is displayed as an oscillator plotting histogram bars. Positive bars indicate a bullish trend, while negative bars indicate a bearish trend. Green bars indicate a strengthening bullish trend, while red bars indicate a strengthening bearish trend.
Traders could use this as a trend direction filter, trading only in the direction indicated by the bars. It could also be used as a trend reversal signal, taking trade signals based on the crossing of the bars from negative to positive during a bullish reversal, or vice versa during a bearish reversal.
Arrows and Curves
Arrows and Curves is a momentum indicator which generates trade entry signals based on strong price movements.
The indicator plots two lines above and below price action creating a channel where price is expected to range. During ranging market conditions where the market is contracting, the channel also tends to contract along with price movement.
Strong and explosive momentum typically occurs after a contraction phase. This indicator indicates signals based on price closing outside of the channel in the opposite direction of the previous signal. This would give us an idea that a strong momentum price movement might occur.
Trading Strategy
This trading strategy trades on momentum based on a confluence of price action, trend direction and momentum entry signals.
Trade entries are filtered based on the long-term trend. To identify the long-term trend, we will be using the 200-period Simple Moving Average (SMA). Trend direction will simply be based on the location of price in relation to the 200 SMA. The 200 SMA line should also be sloping in the direction of the trend, indicating that the trend is already gaining momentum.
The next filter would be the Awesome Oscillator. Trades will only be taken in the direction indicated by the Awesome Oscillator. This will be based on whether the AO is positive or negative. This would indicate trend direction and momentum.
Trade signals will be considered based on the signals provided by the Arrows and Curves indicator. This will basically be an arrow pointing the direction of the trade signal.
Then, we will be observing the characteristics of price action around the area of the entry signal. We will be looking for signs of price rejection or momentum. This would be based on candlestick patterns.
Indicators:
- 200 SMA (green)
- ArrowsAndCurves (default setting)
- Awesome (default setting)
Preferred Time Frames: 1-hour, 4-hour and daily charts
Currency Pairs: major and minor pairs
Trading Sessions: Tokyo, London and New York sessions
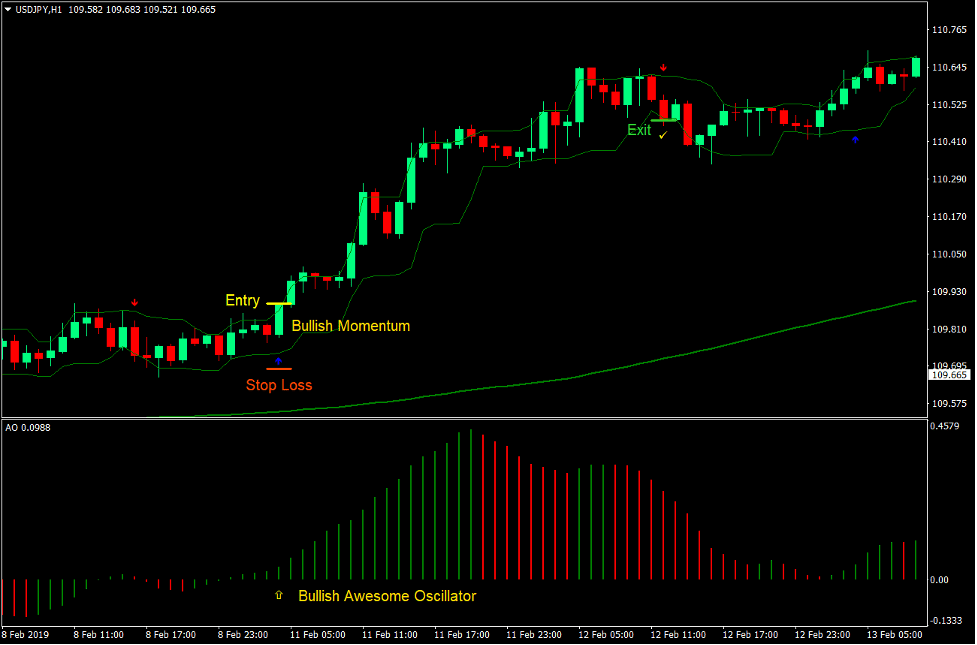
Buy Trade Setup
Entry
- Price should be above the 200 SMA line.
- The 200 SMA line should be sloping up.
- The Awesome Oscillator should be printing positive bars.
- The Arrows and Curves indicator should print an arrow pointing up.
- Enter a buy order on the confirmation of these conditions.
Stop Loss
- Set the stop loss on the fractal below the entry candle.
Exit
- Close the trade as soon as the Arrows and Curves indicator prints an arrow pointing down.
- Close the trade as soon as the Awesome Oscillator bar crosses below zero.
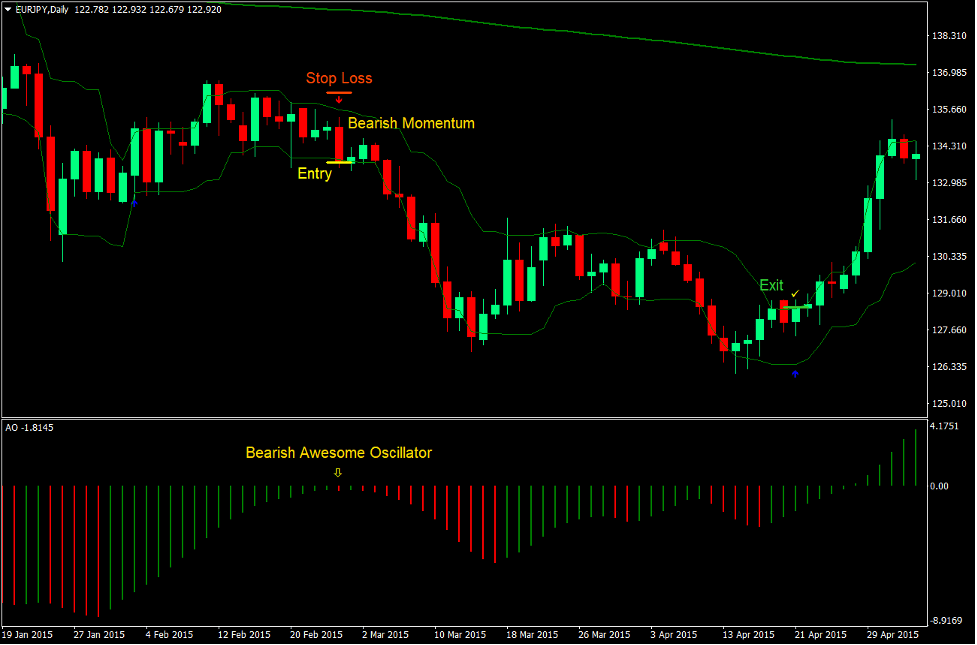
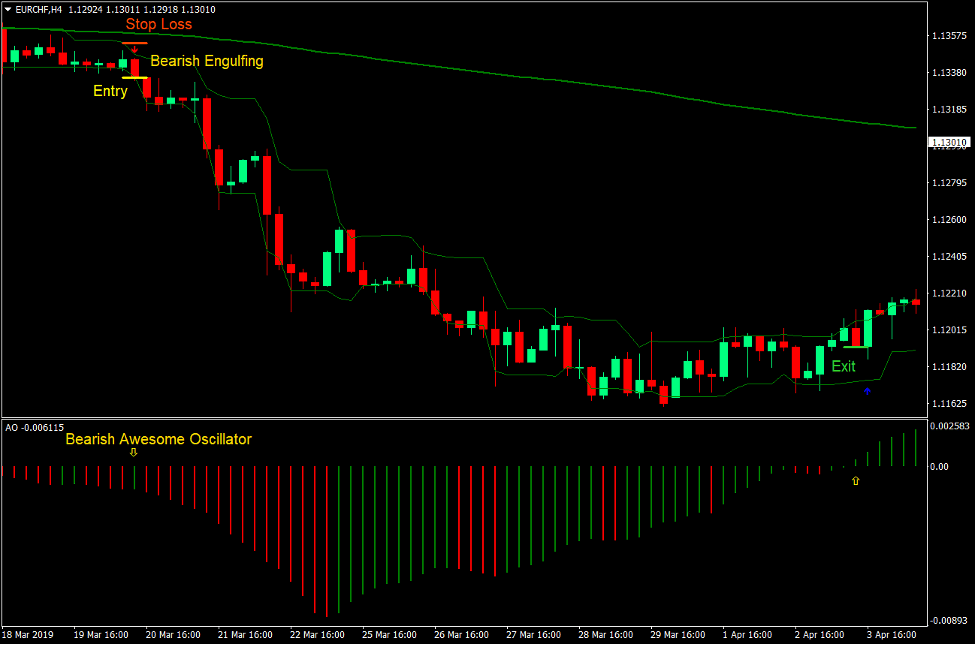
Sell Trade Setup
Entry
- Price should be below the 200 SMA line.
- The 200 SMA line should be sloping down.
- The Awesome Oscillator should be printing negative bars.
- The Arrows and Curves indicator should print an arrow pointing down.
- Enter a sell order on the confirmation of these conditions.
Stop Loss
- Set the stop loss on the fractal above the entry candle.
Exit
- Close the trade as soon as the Arrows and Curves indicator prints an arrow pointing up.
- Close the trade as soon as the Awesome Oscillator bar crosses above zero.
Conclusion
This trading strategy is a momentum strategy which is aligned with the long-term trend.
Momentum strategies such as this tend to produce excellent entry signals. Price would usually move in the direction of the momentum candle for some time allowing traders to be gaining at the start of the trade.
However, there are situations in which price would reverse sharply after such a momentum move. To mitigate losses during these situations, traders should learn to trail the stop loss as the market moves in the direction of the trade. This would allow traders to protect floating profits and earn more consistently from the market.
Recommended MT4 Brokers
XM Broker
- Free $50 To Start Trading Instantly! (Withdraw-able Profit)
- Deposit Bonus up to $5,000
- Unlimited Loyalty Program
- Award Winning Forex Broker
- Additional Exclusive Bonuses Throughout The Year

>> Sign Up for XM Broker Account here <<
FBS Broker
- Trade 100 Bonus: Free $100 to kickstart your trading journey!
- 100% Deposit Bonus: Double your deposit up to $10,000 and trade with enhanced capital.
- Leverage up to 1:3000: Maximizing potential profits with one of the highest leverage options available.
- ‘Best Customer Service Broker Asia’ Award: Recognized excellence in customer support and service.
- Seasonal Promotions: Enjoy a variety of exclusive bonuses and promotional offers all year round.

>> Sign Up for FBS Broker Account here <<
Click here below to download: