


Trading need not be complicated. Sometimes traders overcomplicate things for no reason. Even with complicated strategies using multiple filters, traders still find themselves having similar results when compared to traders using simple strategy.
Although complex strategies could have some advantages, overcomplicating strategies could also lead to fatigue, which making traders more prone to errors. Strategies with simple mechanics on the other hand allow traders to focus on observing how the market is moving, allowing them to take more high probability trades.
Momentum strategies are some of the simplest type of trading strategies. Traders simply identify if the market is gaining momentum and trade with it.
3 MA Fan Momentum Forex Trading Strategy is a momentum trading strategy which uses only two indicators. These indicators could pinpoint areas of reversal which could have momentum behind it. If the market does gain momentum, it could then result in a strong trending market.
3 MA Fan Indicator
3 MA Fan indicator is a custom technical indicator which identifies the general trend direction of a currency pair.
One of the most common techniques to identify trend direction is by using a set of moving averages. The trend is based on how the moving averages are stacked. If the fastest moving average is above the set, then the market is considered bullish. If the fastest moving average is below the set, then the market is considered bearish.
The 3 MA Fan indicator is based on this concept. It uses three moving averages to identify trend direction. It could also be used to observe trend strength since the indicator not only reads the trend direction on the current timeframe, but also identifies trend direction on the other timeframes. Trades taken in the direction of the trend indicated by most timeframes tend to produce better results because the currency pair is said to be trending across different time horizons.
Relative Strength Index
Relative Strength Index (RSI) is one of the most popular technical indicators used by many traders. It is an oscillating indicator which could be used for a variety of purposes depending on the strategy of the trader.
This oscillator plots a line that could oscillate between 0 to 100. It has markers at 30 and 70 which are used to identify overextended price conditions. Lines below 30 indicate an oversold market while lines above 70 indicate an overbought market. Traders could then use this information to trade mean reversal setups.
Some traders would also put markers on level 45, 50 and 55. A line that generally stays above 50 with a support at 45 indicates a bullish trending market, while a line that stays below 50 with a resistance at 55 indicates a bearish trending market.
The market could also be identified to have a strong bullish momentum if it breaches strongly above 55, and a strong bearish momentum if it drops below 45.
Trading Strategy
This strategy produces trade signals that have momentum which could lead to a trend using the 3 MA Fan indicator and the RSI.
The probable start of a trend is identified based on the fanning out of the three moving average lines. The lines should be stacked in the correct order to confirm a valid start of a fresh trend.
On top of this, the fanning out of the 3 MA Fan indicator should also be accompanied by the RSI line indicating a strong momentum. This means the RSI line should breach above 55 in a bullish setup, and below 45 in a bearish setup.
The trade is then maintained if the trend is in place. This is identified by having price stay on the correct side of the midline moving average and the RSI line not reversing towards the support or resistance level.
Indicators:
- 3MAFan (default setting)
- Relative Strength Index
Preferred Time Frames: 5-minute, 15-minute, 30-minute and 1-hour charts
Currency Pairs: major and minor pairs
Trading Sessions: Tokyo, London and New York sessions
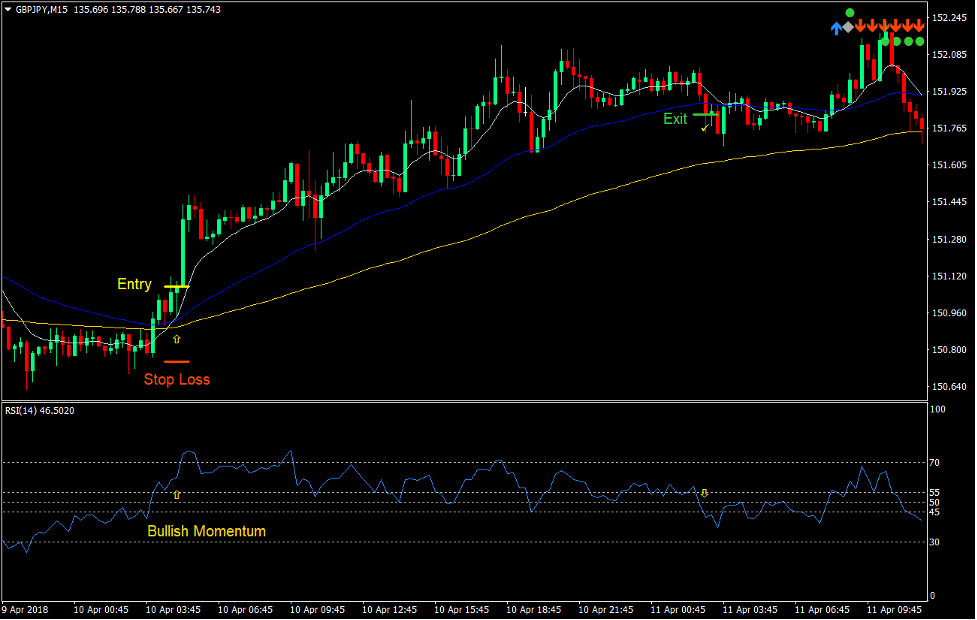
Buy Trade Setup
Entry
- The turquoise moving average line (short-term moving average) should cross above the blue (mid-term) and gold (long-term) moving average lines.
- The 3 MA Fan moving average lines should start to fan out in the following order:
- Turquoise: top
- Blue: middle
- Gold: bottom
- The crossover should be in line with the RSI line crossing above 55.
- Enter a buy order on the confirmation of these conditions.
Stop Loss
- Set the stop loss on the fractal below the entry candle.
Exit
- Close the trade as soon as price closes below the blue moving average line.
- Close the trade as soon as the RSI line falls below 45.
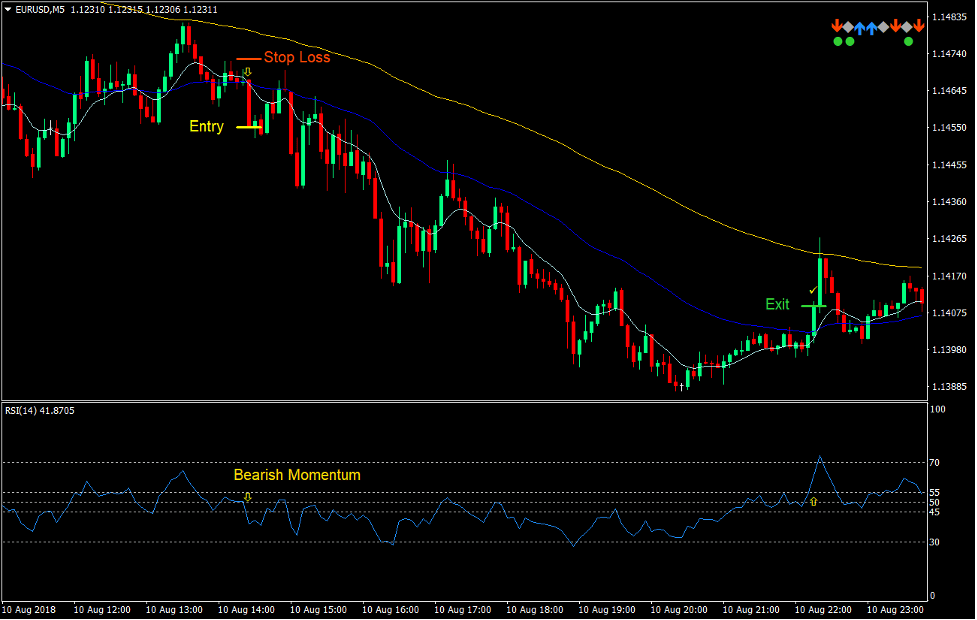
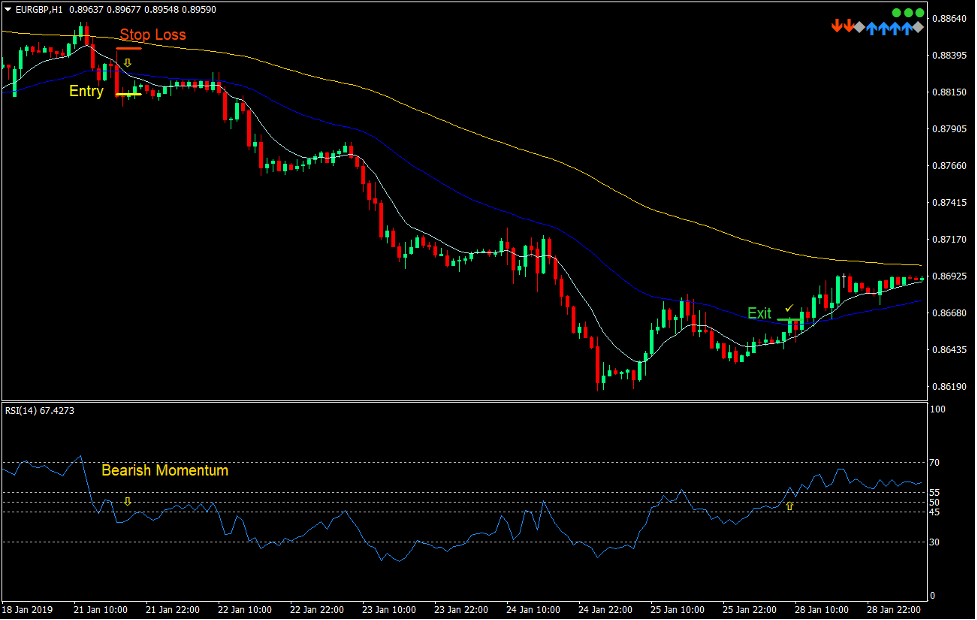
Sell Trade Setup
Entry
- The turquoise moving average line (short-term moving average) should cross below the blue (mid-term) and gold (long-term) moving average lines.
- The 3 MA Fan moving average lines should start to fan out in the following order:
- Turquoise: bottom
- Blue: middle
- Gold: top
- The crossover should be in line with the RSI line crossing below 45.
- Enter a sell order on the confirmation of these conditions.
Stop Loss
- Set the stop loss on the fractal above the entry candle.
Exit
- Close the trade as soon as price closes above the blue moving average line.
- Close the trade as soon as the RSI line breaches above 55.
Conclusion
Crossover strategies using three moving average lines is a basic momentum or trend reversal strategy used by many traders. The success of using this type of strategy is based on how traders pick the trend direction.
Using this indicator could greatly improve trade setups using three moving average line crossovers. This is because traders could also identify the general trend direction based on the higher timeframe just by looking at the upper right-hand corner of the chart.
This strategy also works well as a precision entry strategy on the lower timeframes, which is also aligned with a higher timeframe trade setup.
If used in the correct scenario, this strategy could produce high quality trade setups that could produce huge returns.
Recommended MT4 Brokers
XM Broker
- Free $50 To Start Trading Instantly! (Withdraw-able Profit)
- Deposit Bonus up to $5,000
- Unlimited Loyalty Program
- Award Winning Forex Broker
- Additional Exclusive Bonuses Throughout The Year

>> Sign Up for XM Broker Account here <<
FBS Broker
- Trade 100 Bonus: Free $100 to kickstart your trading journey!
- 100% Deposit Bonus: Double your deposit up to $10,000 and trade with enhanced capital.
- Leverage up to 1:3000: Maximizing potential profits with one of the highest leverage options available.
- ‘Best Customer Service Broker Asia’ Award: Recognized excellence in customer support and service.
- Seasonal Promotions: Enjoy a variety of exclusive bonuses and promotional offers all year round.

>> Sign Up for FBS Broker Account here <<
Click here below to download: