


Price often moves in market swings. If you would observe price action closely, you would notice that although its movements may seem erratic, it also often has an identifiable price swing as it oscillates on the price chart. Traders who can time these oscillations correctly can potentially profit from the forex market on a consistent basis. However, it is not easy to determine.
One of the ways traders identify such market swings and its corresponding reversals is by observing for divergences. This strategy is an example of a divergence based trading strategy which uses a modified version of the MACD as the basis for identifying divergences.
Zigzag MACD Candle Indicator
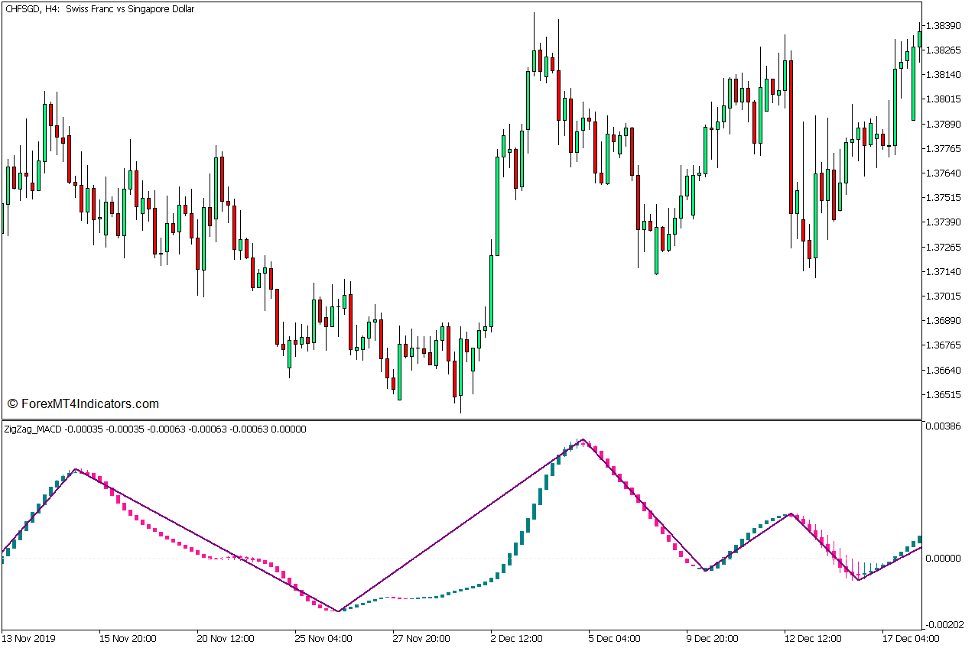
The Zigzag MACD Candle Indicator is a custom technical indicator which is based on the combination of the classic Moving Average Convergence and Divergence (MACD) oscillator and the Zigzag Indicator. In fact, it is a Zigzag Indicator applied on a MACD oscillator.
This indicator computes for the MACD just as a standard MACD would. It computes for the difference between two underlying Exponential Moving Averages (EMA), which are preset as 12 bars and 26 bars. It also computes for an underlying signal line, which is preset as a 9 period Simple Moving Average (SMA) of the difference between the two EMAs.
However, instead of plotting MACD lines and its corresponding signal line, this indicator uniquely presents the MACD as bars. These bars are preset to somehow resemble Heiken Ashi Moving Average bars, but users can opt to have the indicator plot bars that somehow resemble the standard Heiken Ashi Candlestick bars. The color of the bars also changes whenever it detects trend or momentum reversals. It plots teal bars to indicate a bullish trend or momentum, and pink bars to indicate a bearish trend or momentum.
The indicator then identifies the peaks and dips of the MACD bars’ oscillations based on the bars moving against a prior swing more than a preset percentage, just as most Zigzag Indicators would. It then plots a line that connects the identified peaks and dips on the MACD bars forming a zigzag like pattern.
The variables of the Zigzag component of this indicator are “ExtDepth”, “ExtDeviation”, and “ExtBackstep”, which are similar to most Zigzag Indicators.
Divergence Trading
When observing a price chart, you would notice that price action typically forms peaks and dips as price oscillates on the price chart. These peaks and dips are what we call the swing highs and swing lows.
Many traders use oscillators, which are indicators that plot lines or bars which mimic the movement of price action on a separate indicator window. Since oscillators mimic price action, it also forms peaks and dips which usually coincide with the swing highs and swing lows of price action. It also follows that the height and depth of its peaks and dips would correlate with the height and depth of the swing highs and swing lows of price action.
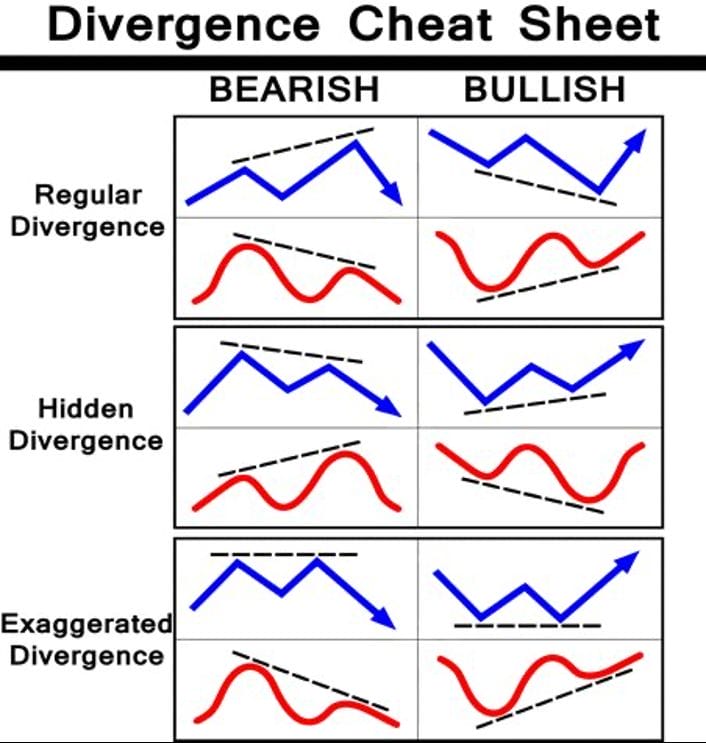
In technical trading, divergences are points on the price chart wherein the height and depth of the peaks and dips on the oscillator would not correlate with the height and depth of the swing highs and swing lows on price action relative to the prior peaks and dips, as well as the swing highs and swing lows. Such divergence between an oscillator and price action usually indicates a potentially strong reversal on the next price swing.
Below is a chart which shows the various types of divergences.
Trading Strategy Concept
This trading strategy trades on divergences based on the Zigzag MACD Candle Indicator.
Valid peaks and dips on an oscillator are usually difficult to identify. Minor oscillations often cause traders to pinpoint the wrong peaks and dips which then results in a wrongly identified divergence signal.
Since the Zigzag MACD Candle Divergence Indicator automatically plots a zigzag line which identifies the peaks and dips, it would be much easier for us to identify the valid divergence reversal signals. These swing highs and swing lows are also usually identified by the indicator near the point where the color of the oscillator bars change. This then would be our entry signal. We could then keep the trade open as long as the color of the oscillator bars remain the same indicating the direction of our trade.
Buy Trade Setup
Entry
- Identify a bullish divergence setup by comparing the valid dips identified by the Zigzag MACD Candle Indicator with its corresponding swing lows on price action.
- Open a buy order as soon as the oscillator bars change to teal.
Stop Loss
- Set the stop loss on the support below the entry candle.
Exit
- Close the trade as soon as the oscillator bars change to pink.
Sell Trade Setup
Entry
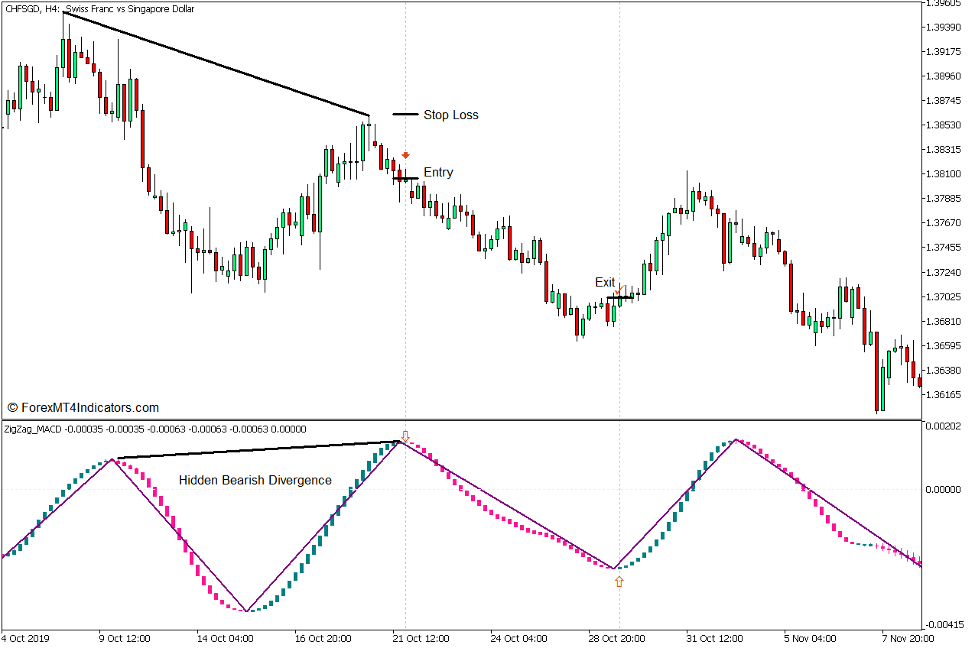
- Identify a bearish divergence setup by comparing the valid peaks identified by the Zigzag MACD Candle Indicator with its corresponding swing highs on price action.
- Open a sell order as soon as the oscillator bars change to pink.
Stop Loss
- Set the stop loss on the resistance above the entry candle.
Exit
- Close the trade as soon as the oscillator bars change to teal.
Conclusion
Divergence reversal trading is a trading strategy which are commonly used by professional traders both on the retail and institutional level. In fact, there are many traders who claim being consistently profitable using divergence based trading strategies. Among the oscillators used by traders, the MACD is probably one of the most commonly used indicators for identifying divergences. Trading divergences based on the MACD has so much potential if a trader has mastered using this indicator. However, it is not easy to correctly identify valid divergences.
The indicator used in this strategy may help traders in this regard as it allows traders to easily spot and identify valid peaks and dips on the oscillator either based on the zigzag line or the changing of the color of the bars. The only skill that is left to develop would be learning how to identify the correct swing high and swing low on price action. Traders who can master identifying divergences using such indicator may profit from trading using this type of strategy.
Recommended MT5 Brokers
XM Broker
- Free $50 To Start Trading Instantly! (Withdraw-able Profit)
- Deposit Bonus up to $5,000
- Unlimited Loyalty Program
- Award Winning Forex Broker
- Additional Exclusive Bonuses Throughout The Year

>> Sign Up for XM Broker Account here <<
FBS Broker
- Trade 100 Bonus: Free $100 to kickstart your trading journey!
- 100% Deposit Bonus: Double your deposit up to $10,000 and trade with enhanced capital.
- Leverage up to 1:3000: Maximizing potential profits with one of the highest leverage options available.
- ‘Best Customer Service Broker Asia’ Award: Recognized excellence in customer support and service.
- Seasonal Promotions: Enjoy a variety of exclusive bonuses and promotional offers all year round.

>> Sign Up for FBS Broker Account here <<
Click here below to download: