


Moving average crossover trading strategies are some of the most basic types of trend reversal trading strategy that traders use. In fact, most new traders often start with this basic trading strategy. Although this trading strategy is an effective way to identify potential trend reversals, it does have the tendency to produce false trend reversal signals. This is more evident in markets which starting a sideways movement instead of an actual trend reversal. This often results in traders taking losses often whenever the signals are used in a market which is very choppy or is moving sideways.
This trading strategy is a modification of the basic moving average crossover strategy which uses a smoother moving average line, which should result in trend reversal signals which can be more reliable.
YMA Moving Average Indicator
The YMA Indicator is a custom technical indicator developed by Yuriy Tokman. It is a moving average type of indicator which modifies the basic moving average indicator to calculate for the mean price based on the average price of a security within each price bar.
The YMA Indicator incorporates a formula which calculates for the average of the open, high, low, and close values of each candle. It basically adds the four values then divides the sum by four. The resulting average would then be used to calculate for each point on the moving average line. This method creates a moving average line which is much smoother than regular moving average lines.
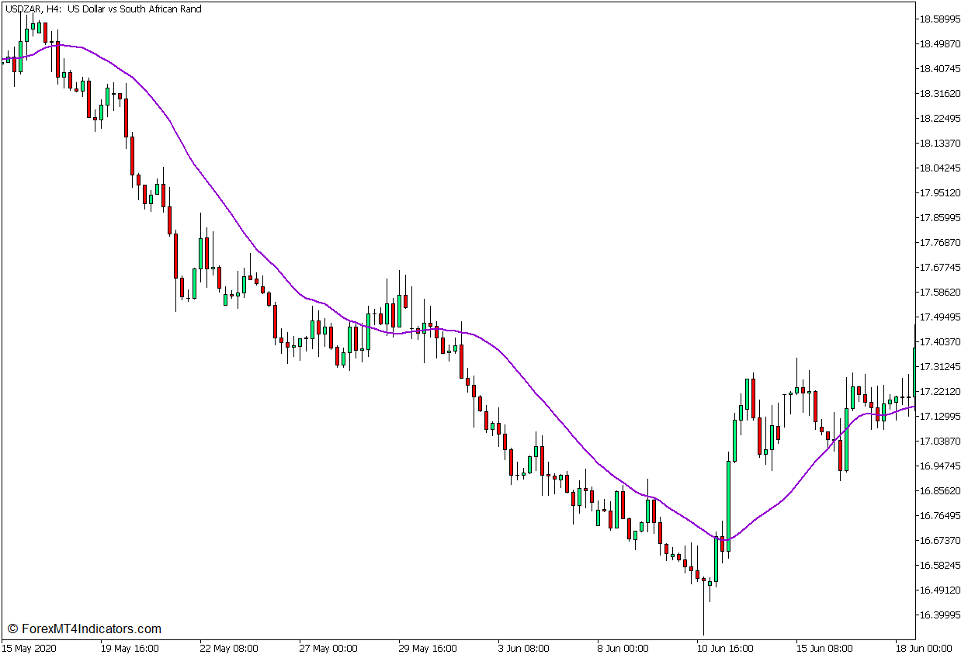 The YMA line can be used in the same manner as most moving average line indicators are used. It can be used to determine the general direction of the trend based on where price action generally is in relation to its line, as well as the slope of its line. The area around the line may also serve as a dynamic support or resistance area where price may bounce from. It may also be used to identify potential trend reversal signals. This could be based on price action breaking through the line or crossing over it. It could also be based on moving average crossovers using multiple YMA lines or pairing it with other moving average lines.
Moving Average Convergence and Divergence
The Moving Average Convergence and Divergence, also popularly known as MACD, is probably one of the most widely used technical indicators. It is an oscillator type of technical indicator which identifies the direction of price momentum based on an underlying calculation of the difference between a pair of moving average lines.
The first data that the MACD indicator calculates for is the difference between two Exponential Moving Average (EMA). It then plots the resulting values either as histogram bars or as an oscillator line. The second data that it calculates for is the values that would plot the signal line. It does this by calculating for the Simple Moving Average (SMA) of the MACD line or bars.
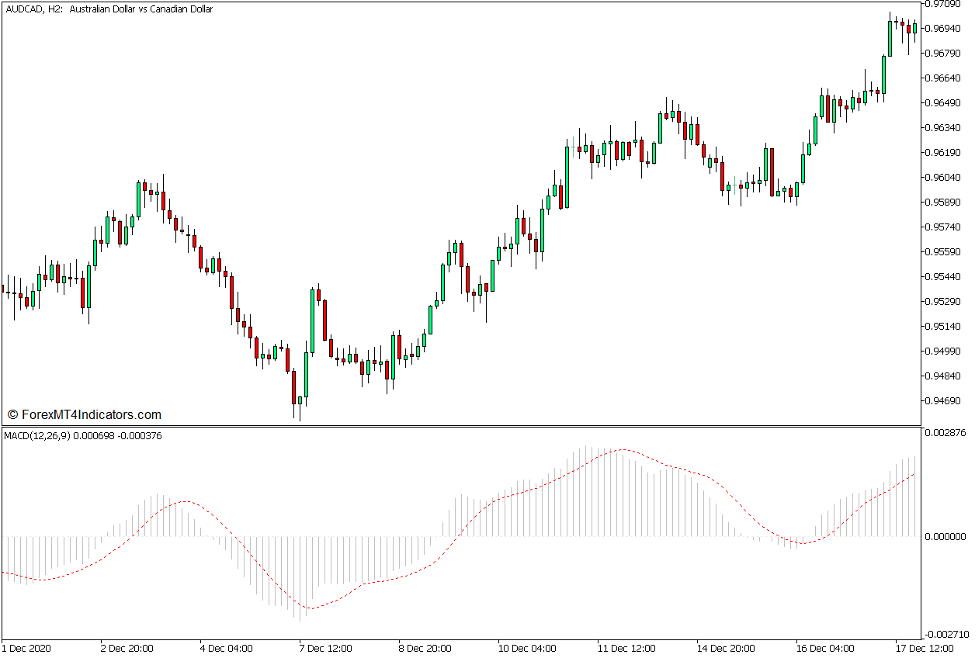
There are several ways to interpret the MACD oscillator. Traders may identify the trend bias based on whether the MACD bars are positive or negative. Positive values indicate a bullish trend bias, while negative values may indicate a bearish trend bias. Traders may also use the MACD to identify momentum direction. This is based on the position of the MACD line or bars in relation to the signal line. The momentum is bullish whenever the MACD bars are above the signal line, and bearish whenever the MACD bars are below the signal line.
Trading Strategy Concept
YMA Moving Average Crossover Forex Trading Strategy for MT5 is a trend reversal trading strategy which is based on the concept of moving average crossovers. It utilizes three elements, which are the 7-bar YMA line, 21-bar YMA line, and the MACD.
The template used in this strategy modifies one of the YMA lines to calculate moving averages based on a seven bar period. We would also modify the color of this YMA line to green for easier identification.
The first trend reversal signal would be a crossover between the 7-bar YMA line (green) and the 21-bar YMA line (violet). Although this is a significant signal, it should not be taken as a standalone trend reversal signal.
The MACD would then be used as an additional trend reversal confirmation. This will be based on the shifting of the MACD bar or line value from positive to negative or vice versa. Trend reversals are confirmed whenever there is a confluence between the crossing over of the two YMA lines and the crossing over of the MACD bars over its midline, which is zero.
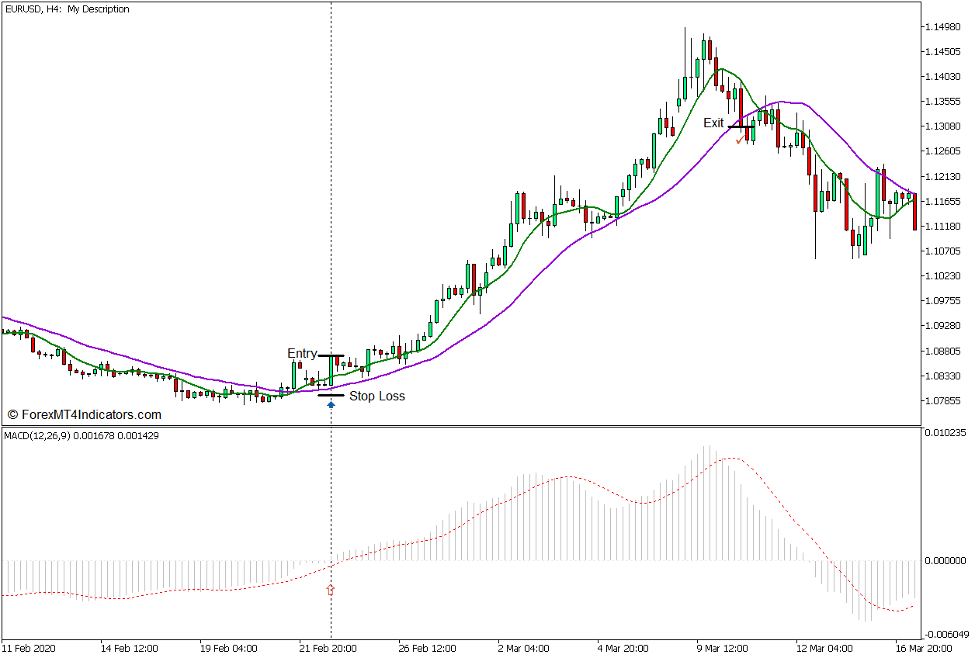
Buy Trade Setup
Entry
- The 7-bar YMA line (green) should cross above the 21-bar YMA line (violet).
- The MACD bars should cross above zero coming from a generally negative value.
- These trend reversal signals should be approximately close to each other.
- Open a buy order on the confluence of these two trend reversal signals.
Stop Loss
- Set the stop loss on the fractal below the entry candle.
Exit
- Close the trade as soon as price closes below the 21-bar YMA line.
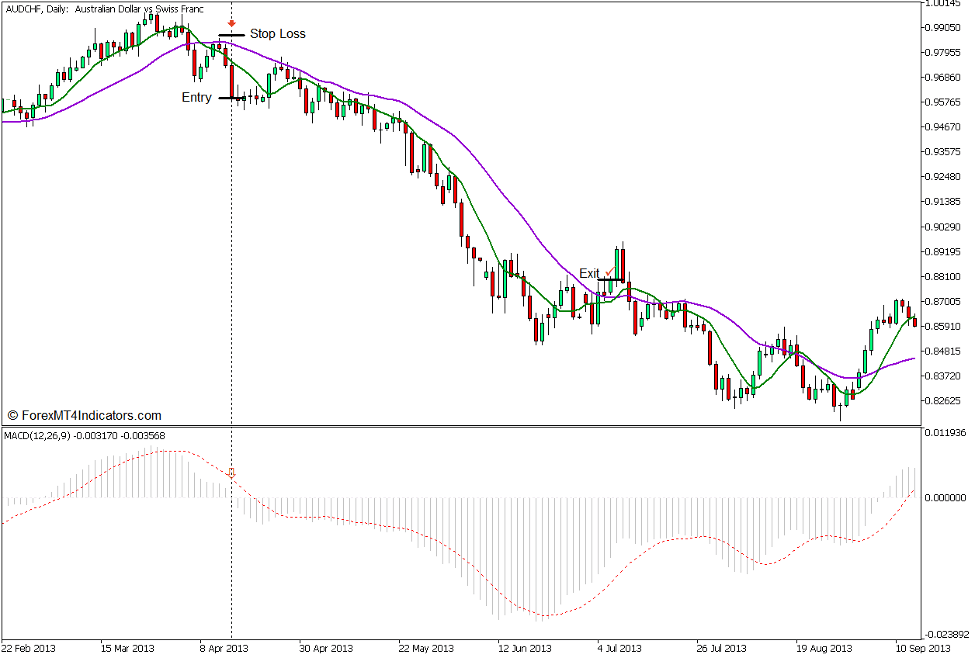
Sell Trade Setup
Entry
- The 7-bar YMA line (green) should cross below the 21-bar YMA line (violet).
- The MACD bars should cross below zero coming from a generally positive value.
- These trend reversal signals should be approximately close to each other.
- Open a sell order on the confluence of these two trend reversal signals.
Stop Loss
- Set the stop loss on the fractal above the entry candle.
Exit
- Close the trade as soon as price closes above the 21-bar YMA line.
Conclusion
This strategy modifies the basic moving average crossover strategy by using the YMA line, which is a smoother version of the basic moving average. It also adds the MACD as an additional confirmation which significantly increases the likelihood of a profitable trade.
Traders who would opt to use this type of trend reversal signal should use it in conjunction with price action and how it behaves on areas near or around trend reversals. This would help them identify potential trend reversals more easily on top of the objective trend reversal signals discussed above.
Recommended MT5 Brokers
XM Broker
- Free $50 To Start Trading Instantly! (Withdraw-able Profit)
- Deposit Bonus up to $5,000
- Unlimited Loyalty Program
- Award Winning Forex Broker
- Additional Exclusive Bonuses Throughout The Year

>> Sign Up for XM Broker Account here <<
FBS Broker
- Trade 100 Bonus: Free $100 to kickstart your trading journey!
- 100% Deposit Bonus: Double your deposit up to $10,000 and trade with enhanced capital.
- Leverage up to 1:3000: Maximizing potential profits with one of the highest leverage options available.
- ‘Best Customer Service Broker Asia’ Award: Recognized excellence in customer support and service.
- Seasonal Promotions: Enjoy a variety of exclusive bonuses and promotional offers all year round.

>> Sign Up for FBS Broker Account here <<
Click here below to download: