


RVI Hidden Divergence Forex Trading
Divergence trading is a well-established method of trading the forex markets or any type of trading market for that matter. Yet, despite its proven track record it is also one of the most overlooked. Most beginning traders are often gravitated to other trading methods but divergences.
In my experience, high probability divergence trading could produce a 40% – 70% win rate. Yes, it could be below 50% at certain periods but because divergences are indications of reversals, there is a high chance of gaining more than what you would have risked, thus the profitable outcome. But all this depends on the type of indicator you are using for your divergences and your accuracy in identifying established divergences.
The Relative Vigor Index (RVI) – An Indicator for Divergences
The RVI or Relative Vigor Index is also an overlooked technical indicator. It is far less popular compared to its cousins, the MACD and the Stochastic Oscillator, yet if considered closely, it could also be as useful as the two.
The RVI is basically an oscillator derived from the open and close of the candles, which in theory should indicate if price is opening and closing higher than previous candles or if it the reverse.
The characteristics of the RVI’s oscillation is that of a smoother type of oscillating indicator, unlike the RSI which is a bit too jagged. It also oscillates at a pretty decent pace, a tad slower than the standard settings of the stochastic oscillator and a tad faster than the MACD. It is somewhat more of an in between.
There are a few notable features of the RVI. One is that it has two oscillating lines, much like the stochastic oscillator. This could already be a signal based on the crossovers of the two lines.
Another feature is that it has a midline fixed on zero, just like most oscillating indicators. The crossing of this midline could also be an entry signal depending on the strategy.
One notable feature, which might seem a setback for other trading strategies, is that it has an open range. It is not restrained by a fixed range like other indicators that are fixed between zero to a hundred or other variations of a range. Yes, you would lose the opportunity to identify overbought and oversold market conditions because of this. But because it is not restrained on a range, its peaks and valleys could be more defined. This feature is great for identifying divergences.
Hidden Divergences – A High Probability Divergence Trading
Divergences are typically disagreements between the highs and lows of the swings in price and how it is reflected on an oscillating indicator.
Price swings have peaks and valleys and depending on the market structure, it could be producing higher or lower peaks and valleys compared to the previous peaks and valleys. The same is true with oscillating indicators. It also has peaks and valleys that could rise or fall, and often times it mimics the movement of price itself. But at times, the peaks and valleys could disagree. In some cases, price could price a higher low while an oscillator prints a lower low, that is a divergence. There are a lot more variations of divergences which you could easily search on the internet.
A constantly rising or falling peaks and valleys mean that a chart is trending. On a bullish trend, peaks and valleys would be constantly higher than the preceding peak or valley. On a bearish trend, peaks and valleys would be constantly lower. However, there cases when even on the price chart the price action is trending, an oscillating indicator could diverge from the pattern of the price chart, printing a lower low on a bullish trend or a higher high on a bearish trend. This is what we call Hidden Divergences.
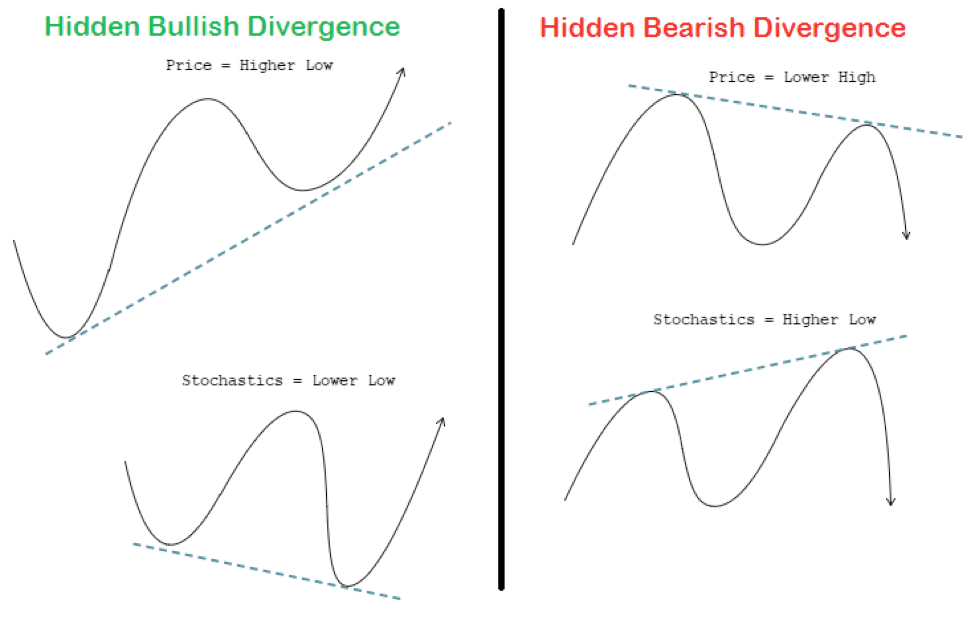
The advantage of hidden divergences is that it is an indication of a reversal but at the same time it agrees with the direction of the trend based on price action. This is because hidden divergences often occur on shallow retracements on a well-established trend. This characteristic makes hidden divergences a high probability trade.
Trade Strategy Concept
The idea behind this trade strategy is to capitalize on the features of the RVI, which allows for smooth yet defined peaks and valleys to identify hidden divergences and trade these setups exclusively.
Entry signals are also a given because the RVI has two lines which could crossover. These crossovers are our entry signals.
There are a couple of filters that would be taken into consideration. First, the RVI crossover should be on the correct side of the midline to determine if the retrace is already deep enough. If we are looking for a buy trade, the crossover should be below the midline hooking up. If looking for a short trade, then the crossover should be above the midline hooking down.
Another filter would be the 200 Exponential Moving Average (EMA). This will serve as a long-term trend filter. We will be taking long trades exclusively if price is above the 200 EMA and short trades if it is below the 200 EMA.
Timeframe: any but preferably 1-hour charts and above
Currency Pair: any
Session: any
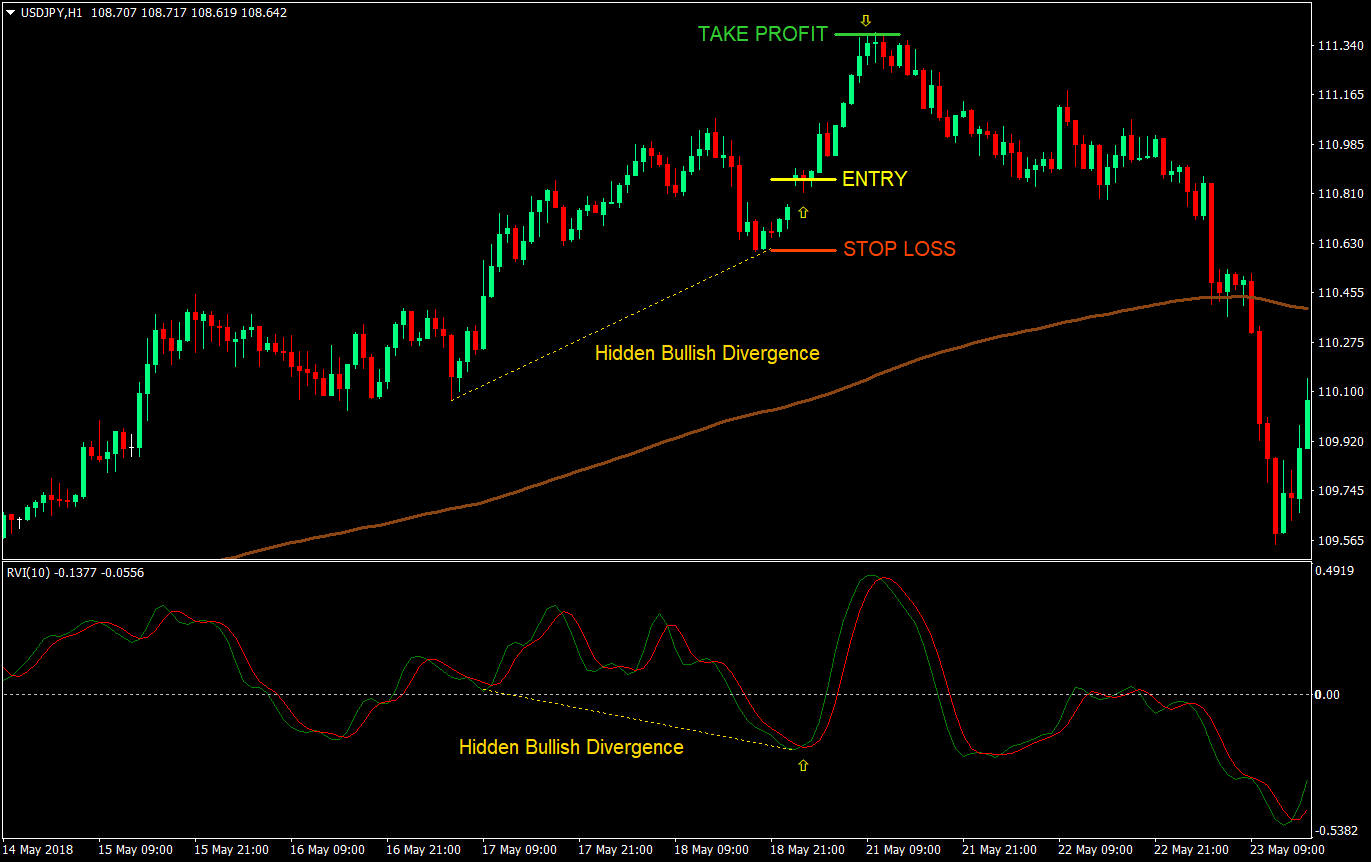
Buy (Long) Trade Setup
Entry
- Price should be above the 200 EMA (brown)
- The RVI lines should be below the zero midline
- A hidden bullish divergence should be identifiable
- The fast RVI line (green) should cross above the slow RVI line (red)
- Enter a buy market order on the confluence of these rules
Stop Loss
- Set the stop loss at the swing low below the entry candle
Take Profit
- Set the target take profit at 2x the risk on the stop loss
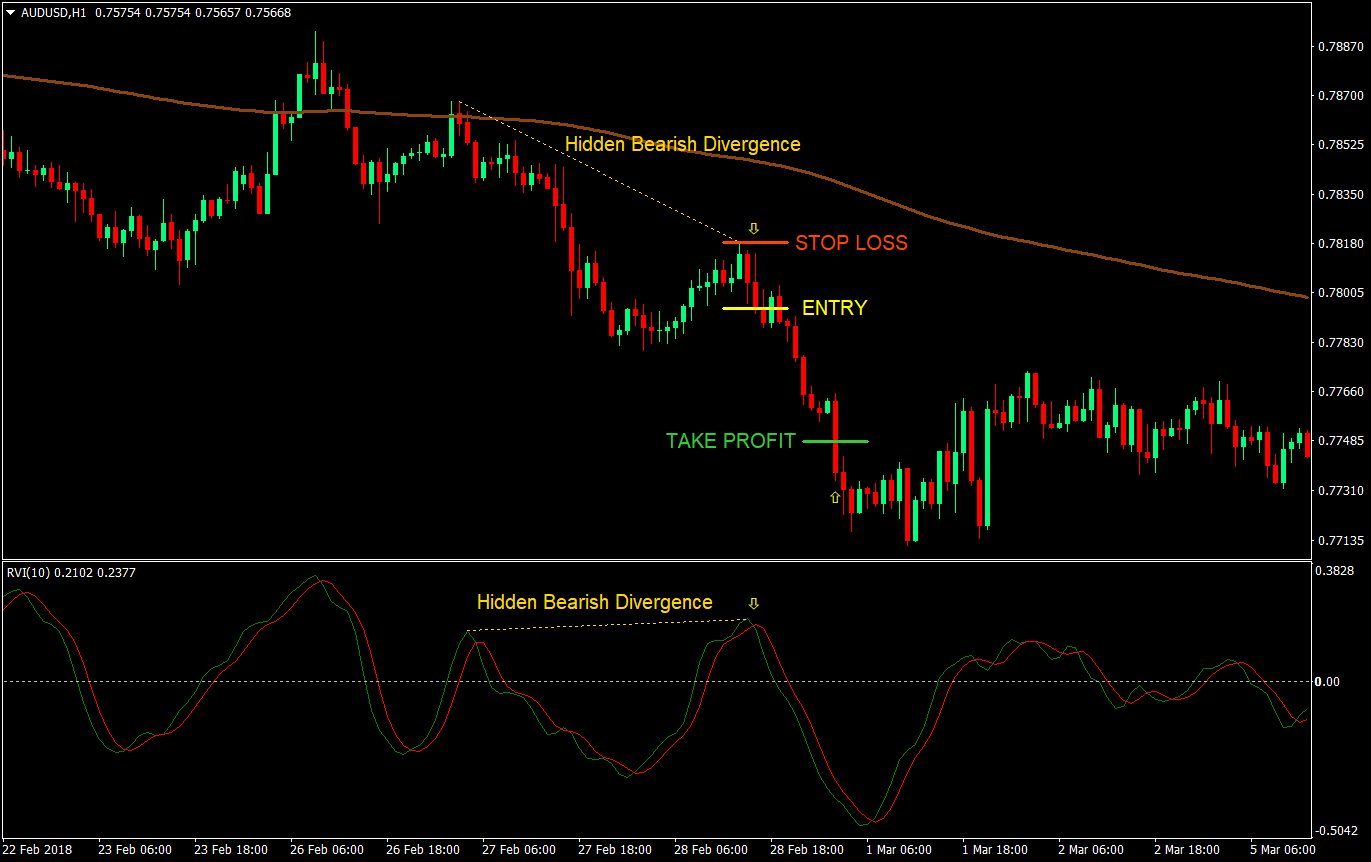
Sell (Short) Trade Setup
Entry
- Price should be below the 200 EMA (brown)
- The RVI lines should be above the zero midline
- A hidden bearish divergence should be identifiable
- The fast RVI line (green) should cross below the slow RVI line (red)
- Enter a sell market order on the confluence of these rules
Stop Loss
- Set the stop loss at the swing high above the entry candle
Take Profit
- Set the target take profit at 2x the risk on the stop loss
Conclusion
This is a working strategy that could bring in profits if traded properly. Practically any indicator that is not too lagging could work when trading hidden divergences. MACDs also do work but the problem is that they tend to lag a bit more. The RVI could be the sweet spot.
There are also a couple of methods used to exit a trade. One is to set take profit targets like we do. Others close the trade as the RVI lines hit the midline, while other close the trade as the RVI lines hooks and crosses over each other for a reversal. Any of these could work but the key is to have bigger profits than losses.
Mix it up and test it and make it your own.
Recommended MT4 Broker
- Free $50 To Start Trading Instantly! (Withdrawable Profit)
- Deposit Bonus up to $5,000
- Unlimited Loyalty Program
- Award Winning Forex Broker
- Additional Exclusive Bonuses Throughout The Year

>> Claim Your $50 Bonus Here <<
Click here below to download: