


Rads Bars Forex Trading Strategy
There are two main factors that determine profitability in trading, win-loss ratio and reward-risk ratio. One of the better ways to earn from forex trading is by having a strategy that allows for a high reward-risk ratio.
Let’s say for example someone comes up to you and tells you to wager on a coin toss. Knowing how coin toss works, it is a 50-50 chance. However, his offer is that every time you lose you would have to pay him $10, but if you win he is going to pay you $20. What would you say? Chances are you would say yes to the proposition and play as long as possible. The same is true with having a strategy with a high reward-risk ratio. Even if you have a strategy that has a win rate of just 50% but has a reward-risk ratio of more than 2:1, you are still going to be profitable. This is the kind of strategy that Rads Bars is.
Rads MACD
The Rads MACD is a custom indicator based on the Moving Average Convergence and Divergence (MACD). It does this by tracking the difference between moving averages and determining its difference or how much it diverges. If the faster moving average is above the slower moving average, the result would be positive and thus it would print positive histogram bars. If it is the reverse, having the slower moving average above the faster moving average, it would be printing negative histogram bars. In a way, it somehow gives entry signals as a crossover strategy would every time the histogram bars cross the zero line.
However, the Rads MACD also determines if the difference between the moving averages is getting bigger or smaller. If the previous histogram bar is lower than the current histogram bar, it prints a lime bar. If the previous bar is higher than the current bar, then it prints a red bar.
Trading Strategy Concept
The Rads MACD on its own have potential to be a good indicator to base a profitable trading strategy on. However, for this strategy, we will be pairing it with AMA_optimized custom indicator.
The AMA_optimized indicator will serve as a filter and an early indication of a possible reversal and potential start of a trend. The AMA_optimized indicator is basically a moving average based indicator that plots blue dots whenever it detects a bullish trend and red dots if it detects a bearish trend. As such, we will be looking for possible buy setups if the AMA_optimized indicator starts printing blue dots, and sell setups if it starts printing red dots.
Then, the Rads MACD. We will be timing our entries based on the crossover of the zero line. If the Rads MACD prints a lime bar above the zero line, it is a signal to buy. If it prints a red bar below the zero line, it is a signal to sell. The magic is with how the Rads MACD could be a great tool to time exits without giving back to much of the profits as the trend reverses back, and not causing us to exit too early too often allowing the strategy to gain huge profits. As discussed earlier, red bars mean the previous bar is higher than the current one. On a bullish trend, this means that the trend might be losing steam, but it is still a bullish trend. On the other hand, on a bearish trend, if it starts printing lime bars although below zero, this could mean that the bearish trend is losing steam.
With this strategy, we will exit the trade if there are three consecutive bars that goes against our trade. This is because it is a signal that the trend might soon start to reverse. So, we exit the trade while we are still in a better position, before the trade reverses on us.
Indicators:
- Rads_MACD
- AMA_optimized: 14-period
Currency Paid: any
Timeframe: 5-minute, 15-minute, 30-minute, 1-hour, 4-hour and daily charts
Trading Session: any
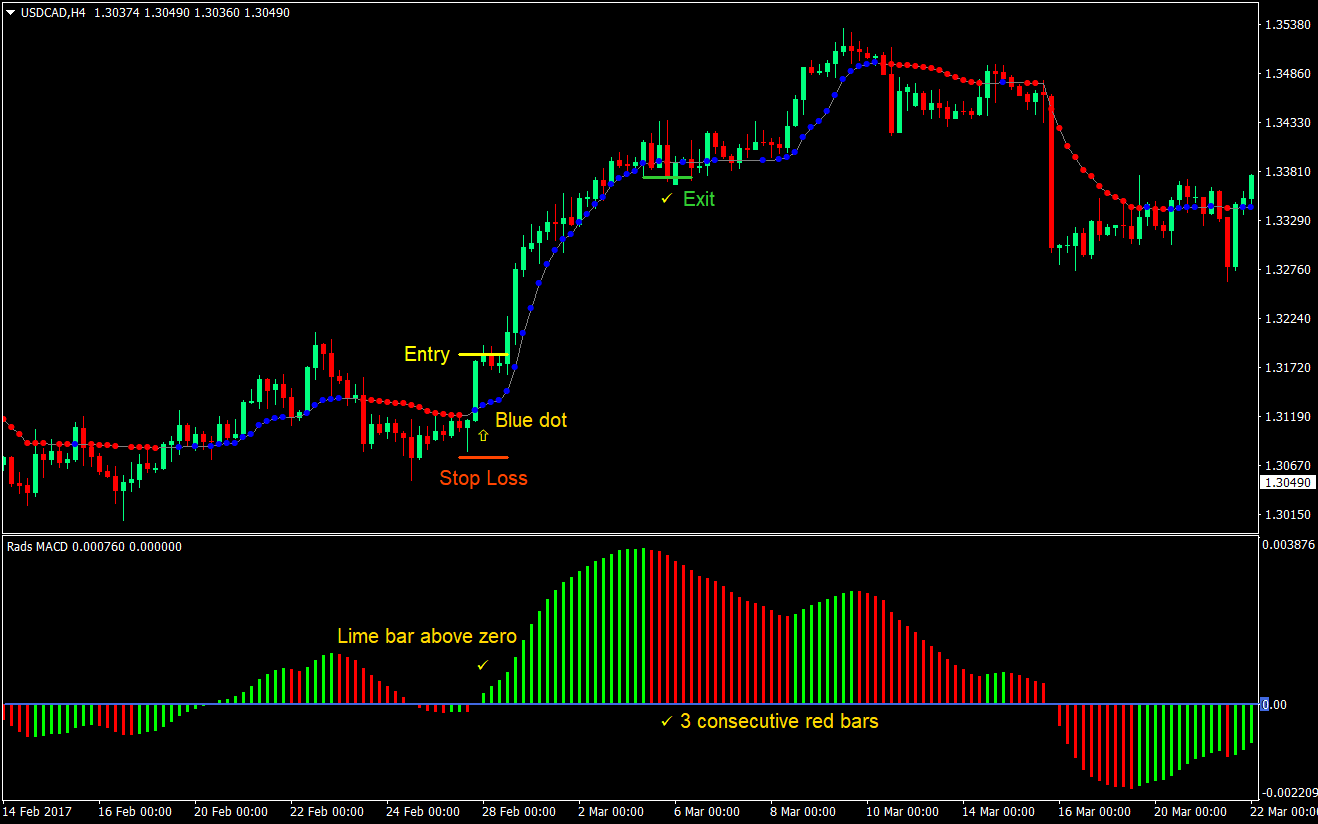
Buy (Long) Trade Setup
Entry
- Price must be above the AMA_optimized line
- The AMA_optimized indicator should print a blue dot
- The Rads_MACD indicator should print a lime bar above the zero line
- Place a buy order on the confluence of the above rules
Stop Loss
- Place the stop loss at the support below the entry
Exit
- Close the trade as soon as three consecutive red histogram bars are printed by the Rads_MACD
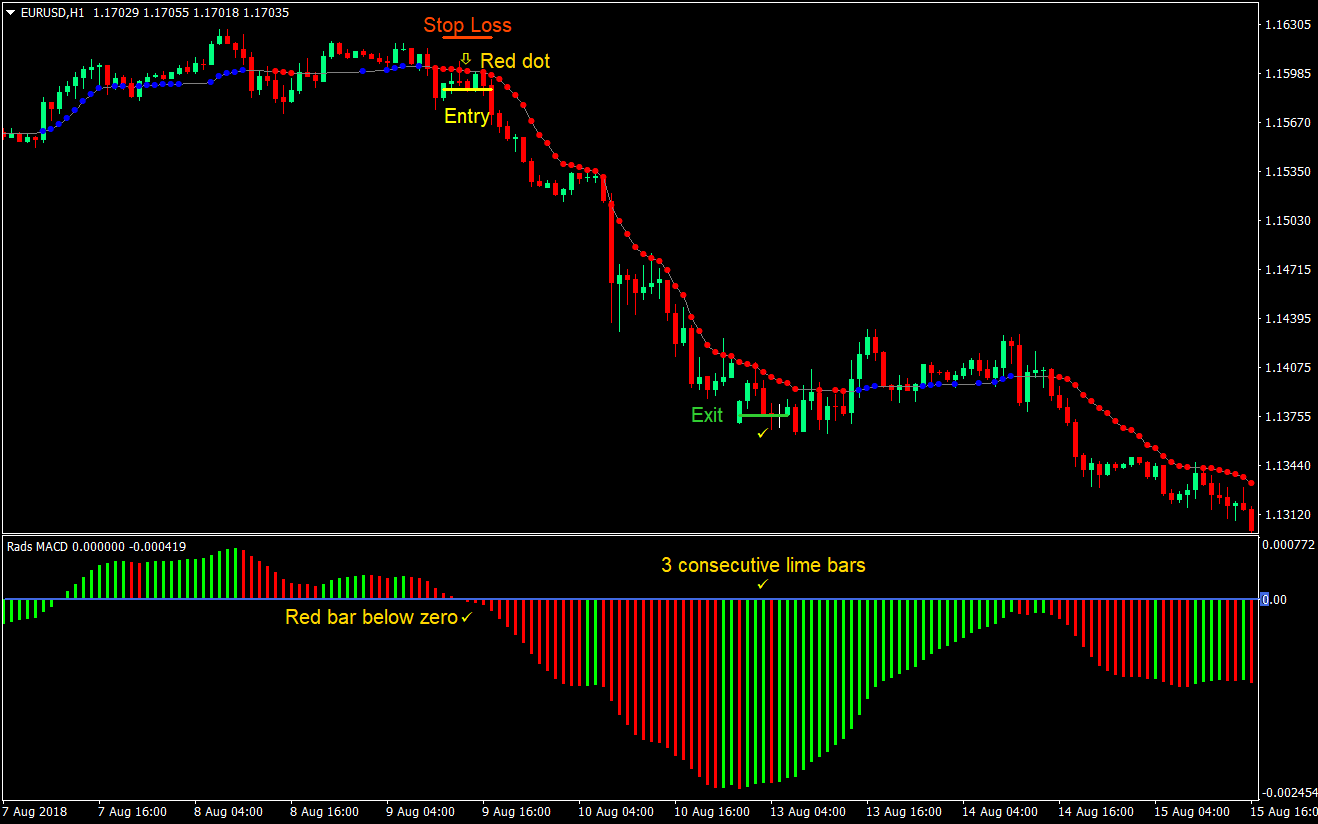
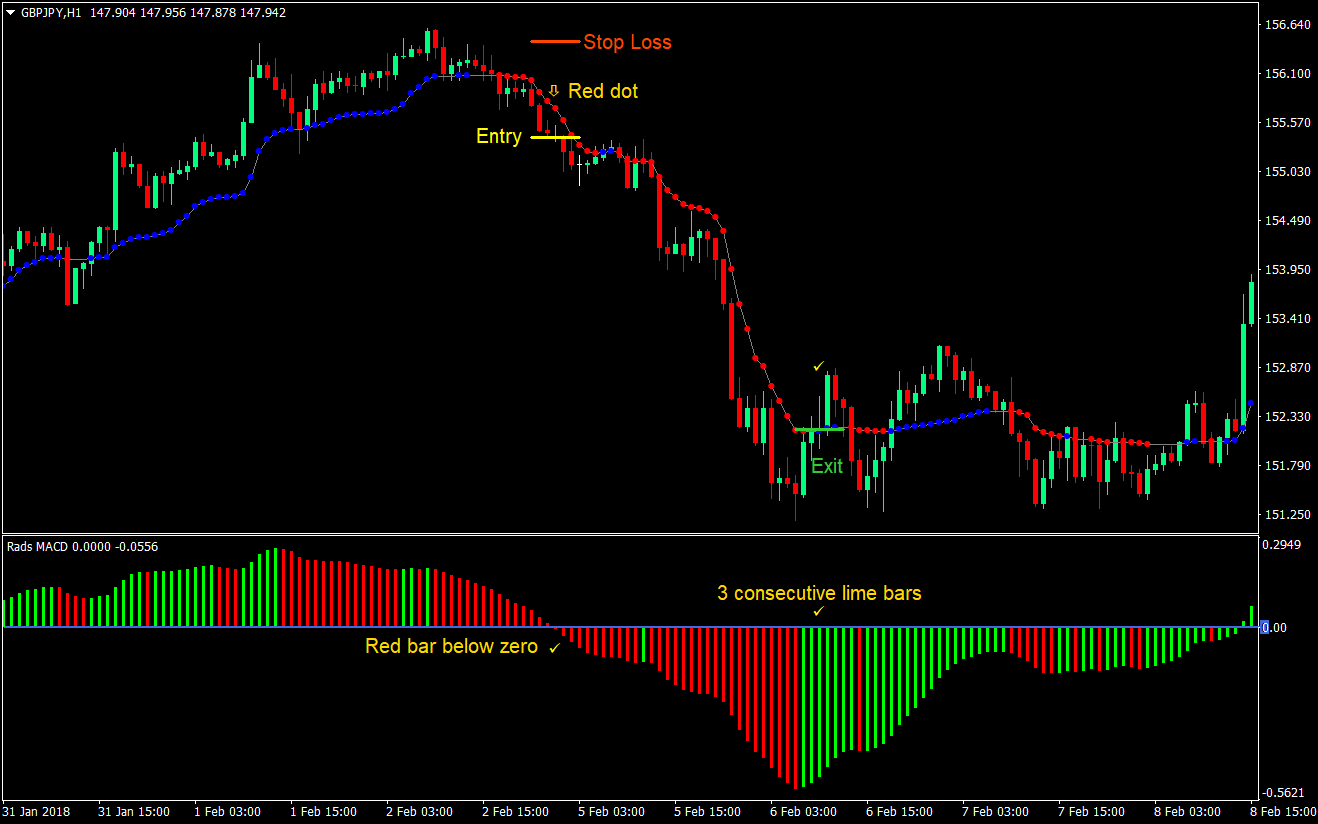
Sell (Short) Trade Setup
Entry
- Price must be below the AMA_optimized line
- The AMA_optimized indicator should print a red dot
- The Rads_MACD indicator should print a red bar below the zero line
- Place a sell order on the confluence of the above rules
Stop Loss
- Place the stop loss at the resistance above the entry
Exit
- Close the trade as soon as three consecutive lime histogram bars are printed by the Rads_MACD
Conclusion
This strategy banks on a high reward-risk ratio. This strategy would typically give around 2:1, 3:1 or better reward-risk ratio, depending on the market condition, the same as with most crossover strategies. The difference however is that it doesn’t wait for the actual reversal of the Rads_MACD signal, which is the crossing over to the other side of the zero line. At that point, much of the profits is usually given back to the market, or worse, the trade ends up at a loss. By exiting a bit earlier using the changing of colors of the histogram bars, we get to retain much of the profit, while not terminating the trade too early.
Recommended MT4 Broker
- Free $50 To Start Trading Instantly! (Withdrawable Profit)
- Deposit Bonus up to $5,000
- Unlimited Loyalty Program
- Award Winning Forex Broker
- Additional Exclusive Bonuses Throughout The Year

>> Claim Your $50 Bonus Here <<
Click here below to download: