


The trading markets are often described as chaotic and unpredictable. Some even ascribe to the “Random Walk Theory”, which in a nutshell compares the markets to a drunk walking randomly whose next step is very unpredictable. However, even Random Walk Theory traders also believe that the direction of price movements can still be predicted if based on the long-term horizon.
It is true, the market is very unpredictable. It is virtually impossible to accurately predict where price would move because it is a product of the beliefs of thousands of traders around the world acting on what they think price would do entering a trading position. Predicting price movements is like reading the minds of thousands of traders. Impossible, right?
However, if you would look closely, despite all the seemingly chaotic and unpredictable nature of the forex market, there are still instances where price moves quite predictably looking at the cycles of peaks and troughs of each price oscillation. These are the types of markets that many traders would want to trade. It gives them an edge allowing them to consistently profit from the market over the long run.
One of the most predictable types of market condition is a trending market. It is quite easy to assess where the market would be generally moving if looking at the trend. The question that remains is where to take the trade. If you would look closer, you would notice that price swings sometimes oscillate in a predictable manner making it easier for traders to plan their trades.
Parabolic Trend Forex Trading Strategy is a trend following strategy which provides is a systematic method for traders to identify potential entry and exit points. It uses a couple of technical indicators which filters out low probability trades and provides entry signals for trade setups with descent probabilities.
Parabolic SAR
Parabolic Stop and Reverse, also known as Parabolic SAR or PSAR, is a trend following indicator which is based on the concept of a parabola.
This indicator basically plots dots called a parabola on the price chart, shadowing the trend direction of price action quite distantly. The idea is that these dots or parabola represent an Extreme Point (EP) in price movements. If price breaches these points, then the trend could be reversing.
Dots plotted below price action indicate a bullish trend, while dots plotted above price action indicate a bearish trend.
Parabolic SAR assumes that traders can be in the market all the time. Traders can hold trades when the trend is still in place and close the trade as soon as the trend reverses. Thus, it is called “Stop and Reverse”.
Traders can trail their stop losses behind the dots and enter a new trade in the direction of the trend whenever the stop loss is hit and the dot shifts to the opposite side of price action.
Although this indicator assumes that traders can always hold a trade, it is best used only when the market is trending as this allows traders to hold trades for bigger profits and avoid losses on erratic reversals.
De Munyuk
The De Munyuk indicator is a custom technical indicator used to identify trend direction.
It is a trend following indicator which indicates directions by plotting bars on its own window. These bars change color depending on the direction of the trend. Lime bars indicate a bullish trend or momentum, while orange red bars indicate a bearish trend or momentum.
The basic use of a De Munyuk indicator is as a trend or momentum reversal signal indicator. Traders can take trades as the color of the bar changes. However, it is best to combine this indicator with other trend signals coming from other indicators or based on price action.
The De Munyuk indicator can also be used as a trend direction filter indicator. Traders can avoid trades that are not aligned with the current trend by using the De Munyuk signal as a filter for a trade setup.
Trading Strategy
This trading strategy is a trend following strategy which uses the confluence of the De Munyuk indicator and the Parabolic SAR as an entry signal.
The 50-period Exponential Moving Average (EMA) is used as a trend direction filter. Trends are based on the general location of price action in relation to the 50 EMA line, the slope of the EMA line, as well as the pattern of the price swings.
As soon as the trend is established, we wait for a confluence of the De Munyuk and Parabolic SAR indicators to confirm a trade setup.
Indicators:
- Parabolic SAR
- 50 EMA
- !De_Munyuk
Preferred Time Frames: 30-minute, 1-hour, 4-hour and daily charts
Currency Pairs: FX majors, minors and crosses
Trading Sessions: Tokyo, London and New York sessions
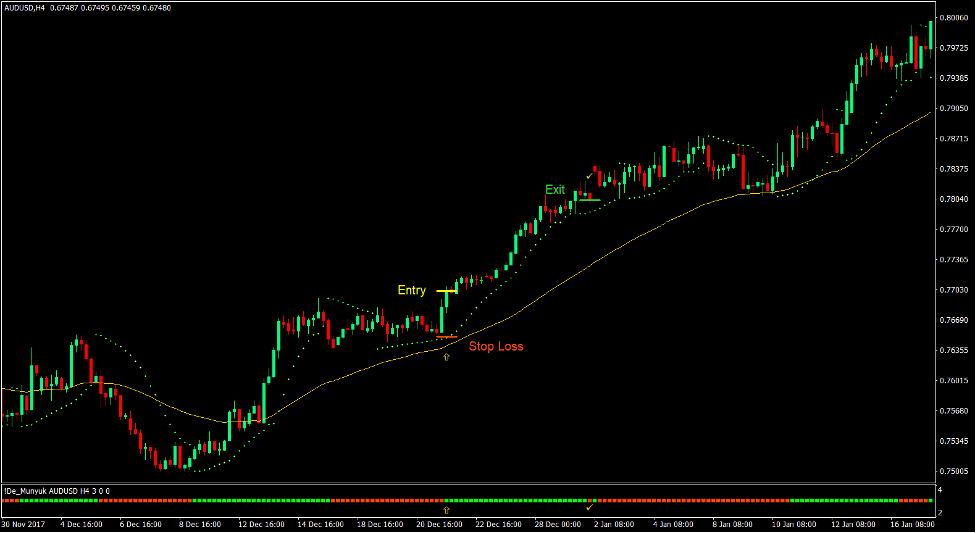
Buy Trade Setup
Entry
- Price action should be above the 50 EMA line.
- Price action should be forming higher swing highs and swing lows.
- The 50 EMA line should slope up.
- The Parabolic SAR dots should shift below price action.
- The De Munyuk bars should change to lime.
- Enter a buy order on the confluence of these conditions.
Stop Loss
- Set the stop loss on the support level below the entry candle.
Exit
- Close the trade as soon as the Parabolic SAR dot shifts above price action.
- Close the trade as soon as the De Munyuk bar changes to orange red.

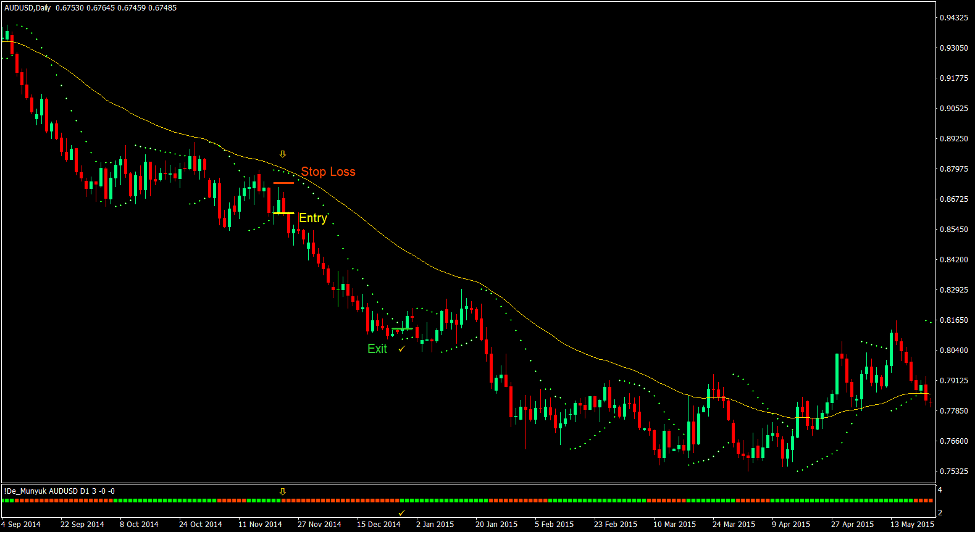
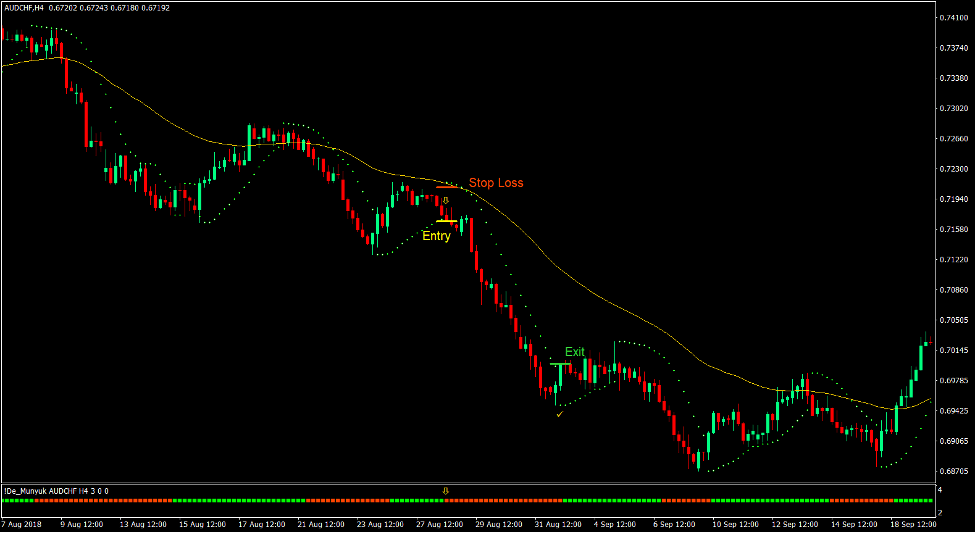
Sell Trade Setup
Entry
- Price action should be below the 50 EMA line.
- Price action should be forming lower swing highs and swing lows.
- The 50 EMA line should slope down.
- The Parabolic SAR dots should shift above price action.
- The De Munyuk bars should change to orange red.
- Enter a sell order on the confluence of these conditions.
Stop Loss
- Set the stop loss on the resistance level above the entry candle.
Exit
- Close the trade as soon as the Parabolic SAR dot shifts below price action.
- Close the trade as soon as the De Munyuk bar changes to lime.
Conclusion
Trend following strategies based on the mid-term trend such as this is a powerful type of trading strategy. It is reliable enough to produce good quality trades, while striking the balance with a responsive trend direction indication. This allows for a trade setup that has a decent strike rate and average risk-reward ratio.
The key to trading this strategy successfully is in being proficient with identifying trending market conditions. This strategy would not work if used in a choppy market. However, if used in a decently trending market, this strategy could consistently produce profitable trades again and again.
Recommended MT4 Brokers
XM Broker
- Free $50 To Start Trading Instantly! (Withdraw-able Profit)
- Deposit Bonus up to $5,000
- Unlimited Loyalty Program
- Award Winning Forex Broker
- Additional Exclusive Bonuses Throughout The Year

>> Sign Up for XM Broker Account here <<
FBS Broker
- Trade 100 Bonus: Free $100 to kickstart your trading journey!
- 100% Deposit Bonus: Double your deposit up to $10,000 and trade with enhanced capital.
- Leverage up to 1:3000: Maximizing potential profits with one of the highest leverage options available.
- ‘Best Customer Service Broker Asia’ Award: Recognized excellence in customer support and service.
- Seasonal Promotions: Enjoy a variety of exclusive bonuses and promotional offers all year round.

>> Sign Up for FBS Broker Account here <<
Click here below to download: