


Entry confirmation strategies are one of the most important components of a trading system. Traders may have an idea where the market may reverse or master all the price action and candlestick patterns but may still fail because they lack accuracy.
A trader’s technical analysis might be right however they might be entering a trade a little too early. Often, traders would get their stop losses hit prematurely before the market rallies in the direction of their trade. Most traders know the pain of experiencing a loss prior to a rally. I know I have.
There are a couple of ways to remedy this problem. First, traders could widen their stop losses. Although this allows some wiggle room for price to move thereby increasing their chances of profiting in a trade, it also decreases the reward-risk ratio so much. This often leads to bigger losses and smaller gains.
Another option for a trader would be to improve accuracy. Increasing accuracy allows traders to enter trades right before price moving strongly in the direction of their trend. Trade entries will not be 100% accurate. No trader could do that. However, improving accuracy allows traders to tighten their stop loss thereby increasing their reward-risk ratio. Bigger gains and smaller losses.
The Notarius Moving Average Oscillator Forex Trading Strategy is a strategy which could be employed in conjunction with a price action strategy to help traders improve the accuracy of their entries.
Notarius Indicator
The Notarius Indicator is an entry signal indicator which helps traders identify possible trend reversal points. This indicator provides entry signals and alerts based on price averaging.
The Notarius indicator prints arrows that indicate the direction of the trend and the candle on which it detects a possible trend reversal. These trend reversals usually occur on areas where strong momentum candles occur either as a reversal signal or as a breakout of a support or resistance.
Oscillator of Moving Average
The Oscillator of Moving Average (OsMA) or Moving Average Oscillator is a trend following indicator which helps traders identify trend direction.
This indicator shows the difference between an oscillator and its moving average over a set period. The OsMA is often derived from the MACD. The MACD’s signal line is an average of the MACD line, thus in an OsMA which is derived from the MACD, the OsMA is the difference between the MACD line and the signal line.
The OsMA indicates trend direction by printing histogram bars. These histogram bars could either be positive or negative. Positive histograms indicate a bullish trending market while a negative histogram indicate a bearish trending market. Crossovers from positive to negative or vice versa are considered as trend reversal signals.
Trading Strategy
The Notarius Moving Average Oscillator Forex Trading Strategy provides entry confirmations based on the confluence of the OsMA indicator and the Notarius indicator.
Confluences between the two indicators usually occur on areas where there is a momentum shift indicated by the candlesticks. These are usually long and solid candlesticks with little wicks, which are bigger than the preceding candles. The confluences between the entry signals occur near or at a momentum candle because it usually takes a strong momentum to cause these indicators to produce trade signals at the same time.
To use this strategy, we will be looking for the OsMA histogram bars to crossover its midline. This crossing over of the OsMA histogram bars should be closely aligned with entry signals provided by the Notarius indicator.
Since this strategy is an entry confirmation, these signals should occur as breakouts from a support or resistance line or a breakout from a price pattern.
Indicators:
- OsMA
- Fast EMA Period: 36
- Slow EMA Period: 52
- Signal SMA Period: 27
- Notarius (default setting)
Preferred Time Frames: 1-hour and 4-hour charts
Currency Pair: major and minor pairs
Trading Session: Tokyo, London and New York
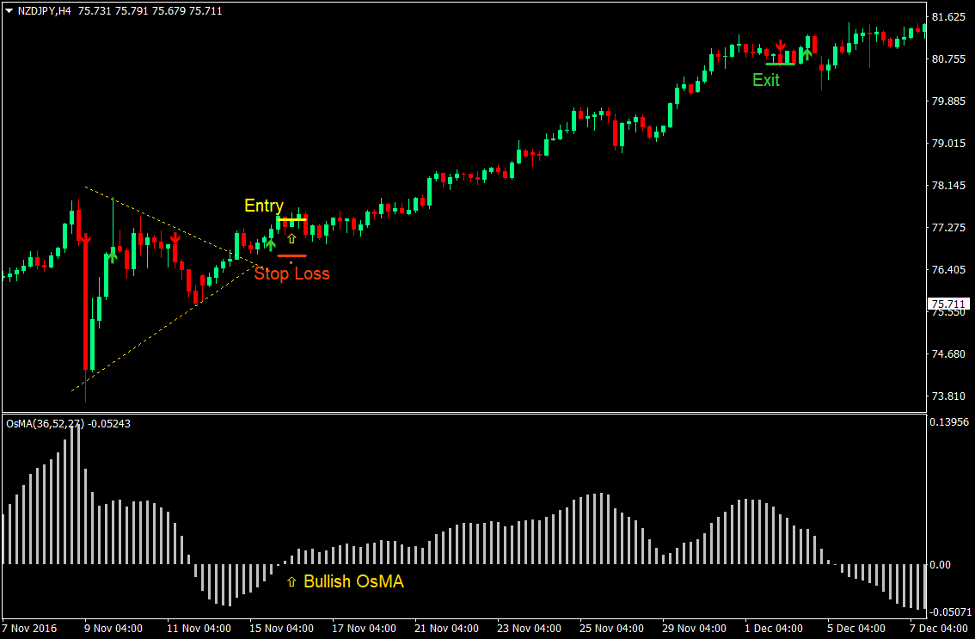
Buy Trade Setup
Entry
- A bullish price pattern or a diagonal resistance line should be clearly observed on the price chart.
- The price candle should breakout above the resistance line or price pattern.
- The OsMA histogram bars should cross above zero indicating a bullish trend reversal.
- The Notarius indicator should print an arrow pointing up providing a bullish entry signal.
- These bullish signals should be closely aligned.
- Enter a buy order on the confluence of the above conditions.
Stop Loss
- Set the stop loss on the support level below the entry candle.
Exit
- Close the trade as soon as the Notarius indicator prints an arrow pointing down.
- Close the trade as soon as the OsMA histogram bars crosses below zero.
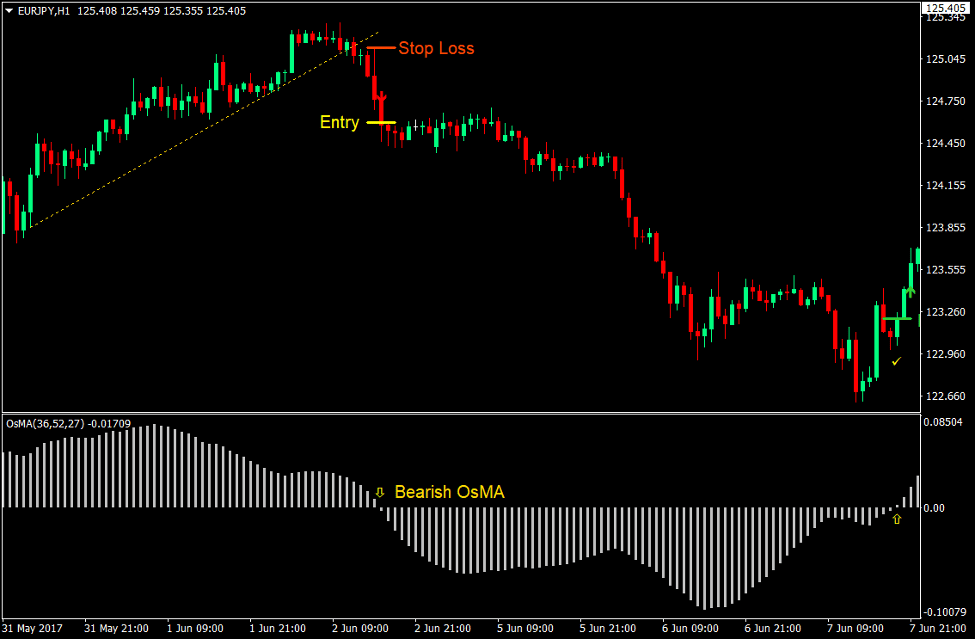
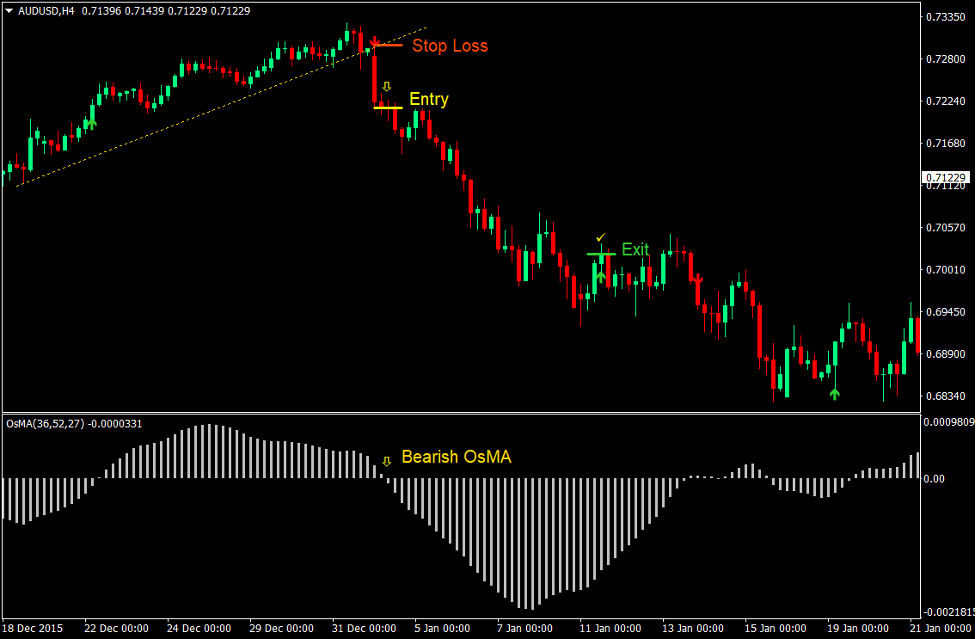
Sell Trade Setup
Entry
- A bearish price pattern or a diagonal support line should be clearly observed on the price chart.
- The price candle should break below the support line or price pattern.
- The OsMA histogram bars should cross below zero indicating a bearish trend reversal.
- The Notarius indicator should print an arrow pointing down providing a bearish entry signal.
- These bearish signals should be closely aligned.
- Enter a sell order on the confluence of the above conditions.
Stop Loss
- Set the stop loss on the resistance level above the entry candle.
Exit
- Close the trade as soon as the Notarius indicator prints an arrow pointing up.
- Close the trade as soon as the OsMA histogram bars crosses above zero.
Conclusion
This trading strategy simply works. It is the type of strategy that provides high quality trade setups that could result in high yields. The key to this strategy is to have patience. It is quite difficult to find patterns and support or resistances daily. However, these are the types of trade setups that could produce good results.
This strategy is best used when it is aligned with trend of the higher timeframe. Aligning with the higher timeframe trend significantly increases the probability of a win using this strategy.
Trade wisely.
Recommended MT4 Brokers
XM Broker
- Free $50 To Start Trading Instantly! (Withdraw-able Profit)
- Deposit Bonus up to $5,000
- Unlimited Loyalty Program
- Award Winning Forex Broker
- Additional Exclusive Bonuses Throughout The Year

>> Sign Up for XM Broker Account here <<
FBS Broker
- Trade 100 Bonus: Free $100 to kickstart your trading journey!
- 100% Deposit Bonus: Double your deposit up to $10,000 and trade with enhanced capital.
- Leverage up to 1:3000: Maximizing potential profits with one of the highest leverage options available.
- ‘Best Customer Service Broker Asia’ Award: Recognized excellence in customer support and service.
- Seasonal Promotions: Enjoy a variety of exclusive bonuses and promotional offers all year round.

>> Sign Up for FBS Broker Account here <<
Click here below to download: