


Trading is about trends. It is about trend direction, the shifting of trends and timing the shifts in trend direction. Yet these trends are defined in many ways. It is defined by its strength, the timeframe that you are looking at, whether these are short-term or long-term trends, and defined by different indicators in a variety of mathematical formulas. These multitude of combinations yields different probabilities and results, which brings confusion to many traders.
So, how do you find your way with this labyrinth called trading? The key is to find indicators which complement and a system that produces either high yielding trades or a high probability trades, or a combination of both.
The Fx Supreme Forex Trading Strategy is one which measures trend direction and trend shifts using three complimentary indicators, all of which work well together.
Commodity Channel Index
The Commodity Channel Index (CCI) was first introduced by Donald Lambert back in 1980. It is an oscillating indicator based on the concept of Typical Price, which basically means the average of the high, low and close of price. The formula also takes into consideration the Simple Moving Average (SMA) and Mean Absolute Deviation (MD).
The CCI assumes that price would stay within +/-100 at about 70 to 80 percent of the time. Traders could then interpret price based on this information.
Mean Reversion traders would interpret the CCI being beyond the +/-100 as being a point where price may reverse. While this is true, price would usually revert to its mean when a trend is overextended, it could also mean the exact opposite.
Momentum traders would interpret the crossing over beyond +/-100 as a sign of strength or momentum. Since price is usually kept within the +/-100 range 70 to 80 percent of the time, it may mean that price is strong enough to push CCI beyond this range.
So, how do we go about this conundrum? Some traders extend the Mean Reversion markers at +/-200. This would somehow filter out less probable mean reversal points.
If using the CCI as a momentum gauge, it would also be good to combine it with other indicators that could show trend reversal or direction.
The 50-Period Moving Average
The 50-period moving average is a widely used indicator. In fact, most professional institutional traders who trade for the big banks, and market analysts use the 50-period moving average as a basis for the mid-term trend. Some traders would even only take trades that agree with the trend direction of the 50-period moving average.
So, how do you identify trend based on the moving average. Some would use the slope direction of the moving average to determine trend direction, whether it is sloping up or down. A rather simpler method would be by identifying the location of price in relation to the moving average. If price is above it, then the market is considered bullish, while if located below the moving average, then it is considered bearish.
Forex Profit Supreme Filter
The Forex Profit Supreme Filter is a custom trend following indicator. This custom indicator is binary in nature. It tells traders plainly whether the market is bullish or bearish. It does this by printing bars on its own window.
For the purpose of this strategy, the indicator is set to print lime green bars when it detects a bullish market condition and orange red bars when it detects a bearish market condition
Trading Strategy
This strategy is a trend following momentum strategy based on the confluence of the above-mentioned indicators.
The Commodity Channel Index (CCI) indicator is traded as a momentum indicator. We will be interpreting the crossing over beyond the +/-100 range as a sign of trend strength and momentum. As such, we will be trading in the direction of the breakout.
Then, we will be using the 50-period Simple Moving Average (SMA) as our basis for crossovers of price action. Entries will be based on the crossing over and breakout of price beyond the 50 SMA.
Lastly, we will be filtering out low probability trends by using the Forex Profit Supreme Filter indicator. We will only be taking trades that conform with the direction indicated by the Forex Profit Supreme Filter.
Indicators:
- 50 SMA (green)
- CCI
- Period: 28
- Forexprofitsupremefilter
Timeframe: 1-hour, 4-hour and daily charts
Currency Pairs: major and minor pairs
Trading Session: Tokyo, London and New York
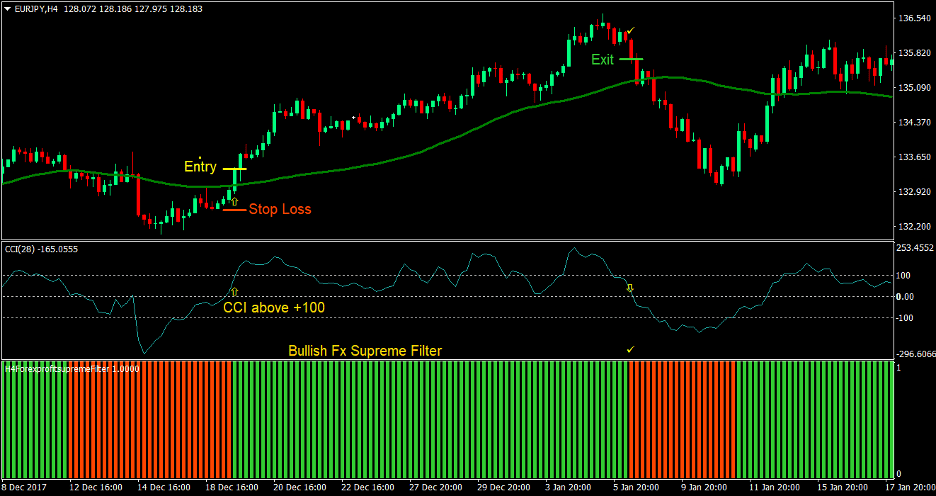
Buy Trade Setup
Entry
- The Forex Profit Supreme Filter should be printing a lime green bar indicating a bullish market condition
- The CCI line should be crossing above +100 indicating a possible start of a bullish trend based on momentum
- Price should cross and close above the 50 SMA indicating a change in trend direction
Stop Loss
- Place the stop loss at the support level below the entry candle
Exit
- Close the trade as soon as the CCI line crosses below +50 indicating the possible end of a strong bullish trend
- Close the trade as soon as the Forex Profit Supreme Filter changes to orange red
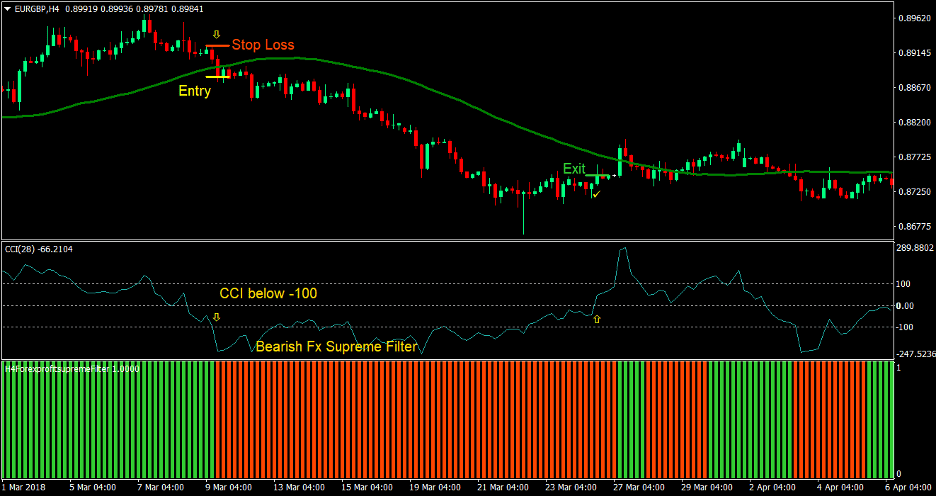
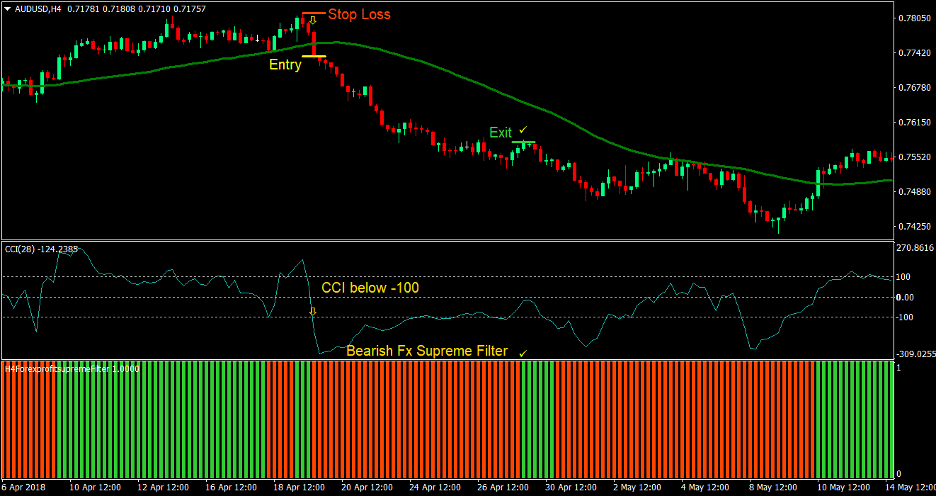
Sell Trade Setup
Entry
- The Forex Profit Supreme Filter should be printing an orange red bar indicating a bearish market condition
- The CCI line should be crossing below -100 indicating a possible start of a bearish trend based on momentum
- Price should cross and close below the 50 SMA indicating a change in trend direction
Stop Loss
- Place the stop loss at the resistance level above the entry candle
Exit
- Close the trade as soon as the CCI line crosses above -50 indicating the possible end of a strong bearish trend
- Close the trade as soon as the Forex Profit Supreme Filter changes to lime green
Conclusion
The Fx Supreme Forex Trading Strategy is a good trend following indicator. This is because it considers trend direction and the momentum that caused the direction change in the first place.
This trading strategy would usually result to a decent combination of a good win ratio and positively yielding reward-risk ratios.
Some knowledge with regards to momentum candles, price action and reversal patterns would be very much useful with this strategy.
Recommended MT4 Brokers
XM Broker
- Free $50 To Start Trading Instantly! (Withdraw-able Profit)
- Deposit Bonus up to $5,000
- Unlimited Loyalty Program
- Award Winning Forex Broker
- Additional Exclusive Bonuses Throughout The Year

>> Sign Up for XM Broker Account here <<
FBS Broker
- Trade 100 Bonus: Free $100 to kickstart your trading journey!
- 100% Deposit Bonus: Double your deposit up to $10,000 and trade with enhanced capital.
- Leverage up to 1:3000: Maximizing potential profits with one of the highest leverage options available.
- ‘Best Customer Service Broker Asia’ Award: Recognized excellence in customer support and service.
- Seasonal Promotions: Enjoy a variety of exclusive bonuses and promotional offers all year round.

>> Sign Up for FBS Broker Account here <<
Click here below to download: