


What goes up would always come down. In trading, even the inverse of this is true. Price would usually revert back to its mean or swing to the opposite extreme after being overbought or oversold. This concept is called mean reversal.
This trading strategy is a simple mean reversal strategy based on the DT Oscillator and the Bollinger Bands.
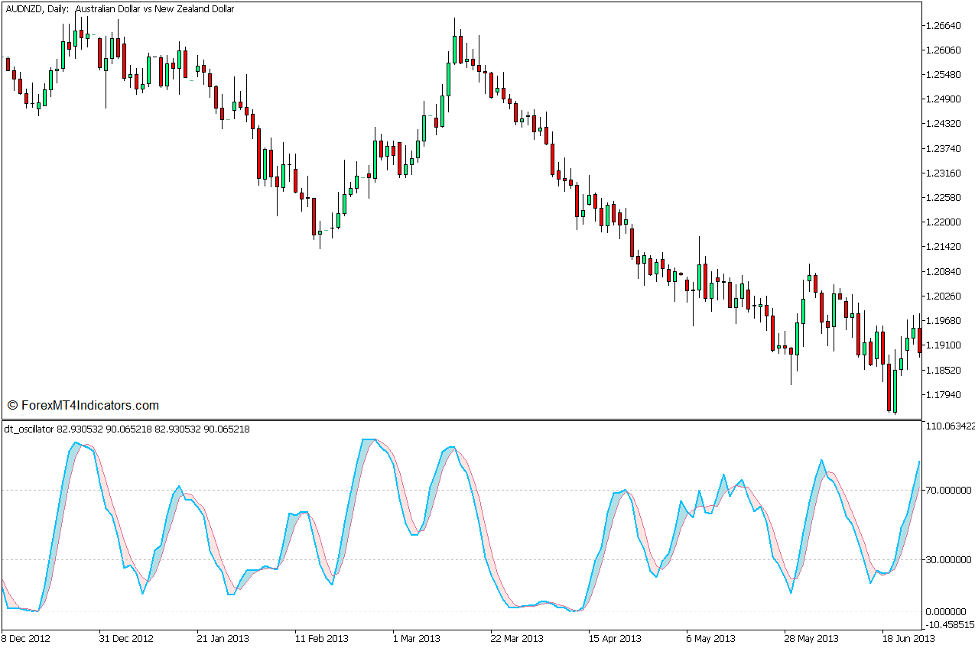
DT Oscillator Indicator
The DT Oscillator is a momentum indicator which is derived from two of the most effective momentum oscillators, which are the Relative Strength Index (RSI) and the Stochastic Oscillator (SO). This indicator plots a Stochastic Oscillator which is based on the Relative Strength Index, instead of price, which is the basic method for calculating a Stochastic Oscillator.
This indicator plots two stochastic lines. The faster line, colored sky blue, is the main DT Oscillator Line. The slower line, colored pale violet-red, is the DT Oscillator Signal Line. These two lines oscillate within the range of zero to 100.
Momentum direction is indicated by how the two lines interact. A DT Oscillator Line which is above the DT Oscillator Signal Line indicates a bullish momentum direction, while a DT Oscillator Line which is below the DT Oscillator Signal Line indicates a bearish momentum direction. In effect, crossovers between the two lines also indicate a momentum reversal.
The DT Oscillator range has markers at levels 30 and 70. These markers represent the oversold and overbought market levels. DT Oscillator Lines which are below 30 are indicative of an oversold market, while DT Oscillators Lines which are above 70 are indicative of an overbought market. Crossovers developing on these areas indicate a potential mean reversal signal, which may revert back to the mean or swing to the opposite extreme.
Bollinger Bands
The Bollinger Bands is a versatile technical indicator which can be used to identify volatility, trend direction, momentum, overbought and oversold price levels, as well as potential mean reversals.
The Bollinger Bands plots three lines which tends to wrap price action in a channel like structure. The main line, which is the middle line is a Simple Moving Average (SMA) which is usually preset at 20 bars. The outer lines are standard deviations shifted above and below the middle line based on the volatility of price action. The standard deviation is usually preset at two standard deviations.
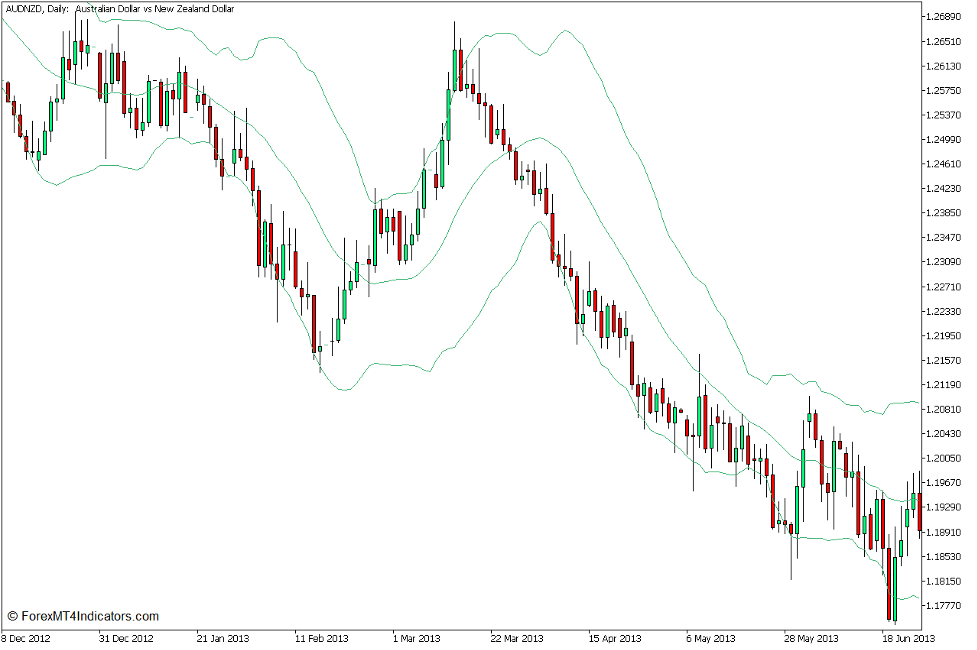
Since the outer bands are based on the standard deviation of price action, it can be used to identify volatility, and in effect the corresponding expansion and contraction phases of the market. The outer bands expand whenever volatility is high and the market is in a market expansion phase, and contracts whenever volatility is low and the market is in a market contraction phase.
Since the middle line of the Bollinger Bands is based on an SMA line, it can also be used to determine trend direction. Price action which is generally on the upper half of the Bollinger Bands is indicate of an uptrend market, while price action which is generally on the lower half of the Bollinger Bands is indicative of a downtrend market.
Momentum breakouts can also be identified based on price closing strongly outside the Bollinger Bands coming from a market contraction phase. Some seasoned traders use this scenario as a momentum breakout trade signal.
Inversely, the same outer bands are also widely used as an overbought and oversold marker. Price breaching above the upper line is indicative of an overbought market, while price dropping below the lower line is indictive of an oversold market. Price action showing signs of price rejection on these areas can be indicative of a mean reversal.
Trading Strategy Concept
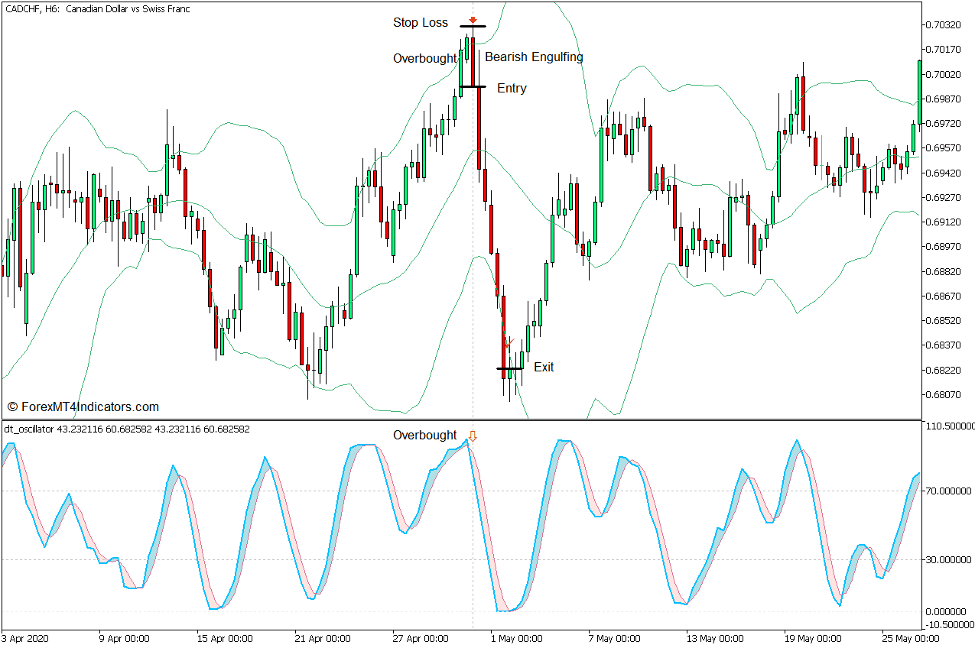
This trading strategy trades on a confluence of mean reversal signals coming from overbought and oversold price levels based on the DT Oscillator Indicator and the Bollinger Bands.
On the DT Oscillator, the DT Oscillator Line should breach outside the 30 to 70 range and start to crossover indicating a reversal back to the middle.
On the Bollinger Bands, price action must breach outside the range of the Bollinger Bands and show signs of price rejection on the levels outside of the range.
Traders can assume a possible mean reversal whenever these two signals are in confluence.
Price action may swing to the opposite extreme, which would be the best case scenario. However, price may also start to reverse as it nears or touches the area near the middle line of the Bollinger Bands. In such case, traders have the option to prematurely exit the trade or hope that price swings to the opposite extreme with strong momentum.
Buy Trade Setup
Entry
- Price action should drop below the lower Bollinger Band line.
- The DT Oscillator Lines should drop below 30.
- Price action should show signs of price rejection based on a bullish reversal candlestick pattern.
- The DT Oscillator Line should cross above the DT Oscillator Signal Line.
- Open a buy order on the confluence of these mean reversal signals.
Stop Loss
- Set the stop loss below the reversal pattern.
Exit
- Allow price action to swing above the upper Bollinger Band line then close the trade as soon as price action shows signs of a bearish reversal.
Sell Trade Setup
Entry
- Price action should breach above the upper Bollinger Band line.
- The DT Oscillator Lines should breach above 70.
- Price action should show signs of price rejection based on a bearish reversal candlestick pattern.
- The DT Oscillator Line should cross below the DT Oscillator Signal Line.
- Open a sell order on the confluence of these mean reversal signals.
Stop Loss
- Set the stop loss above the reversal pattern.
Exit
- Allow price action to swing below the lower Bollinger Band line then close the trade as soon as price action shows signs of a bullish reversal.
Conclusion
This mean reversal trading strategy can be a very effective mean reversal strategy especially in markets with a ranging structure with wide swings. It can also work in markets that are trending provided that the trade signals are taken only in the direction of the trend. However, this strategy may also incur some losing trades whenever the market is in a tight and choppy market range.
This strategy is not perfectly accurate but it has the potential to produce a string of successive wins with decent returns.
Recommended MT5 Brokers
XM Broker
- Free $50 To Start Trading Instantly! (Withdraw-able Profit)
- Deposit Bonus up to $5,000
- Unlimited Loyalty Program
- Award Winning Forex Broker
- Additional Exclusive Bonuses Throughout The Year

>> Sign Up for XM Broker Account here <<
FBS Broker
- Trade 100 Bonus: Free $100 to kickstart your trading journey!
- 100% Deposit Bonus: Double your deposit up to $10,000 and trade with enhanced capital.
- Leverage up to 1:3000: Maximizing potential profits with one of the highest leverage options available.
- ‘Best Customer Service Broker Asia’ Award: Recognized excellence in customer support and service.
- Seasonal Promotions: Enjoy a variety of exclusive bonuses and promotional offers all year round.

>> Sign Up for FBS Broker Account here <<
Click here below to download: