


CCI Hidden Divergence Forex Trading Strategy
The Commodity Channel Index (CCI) developed by Donald Lambert is one of the tools available to traders for free yet isn’t utilized often. This is probably because it is less popular compared to its counterparts such as the RSI, MACD, stochastics, etc. But if you’d look at it closely, it does have a lot of value to offer if used correctly.
The CCI, like its cousins, is also an oscillating indicator. But it also has characteristics and features that is unique only to it. Contrary to common belief, the CCI is an unbounded oscillator. This means that it should be free to oscillate up to whatever number as opposed to being bound by a fixed range. Yes, it does have markers, but it is not limited up to those numbers. It is also somewhat similar to the RSI because of its jagged oscillation, which allows it to shadow price action better.
The CCI has multiple uses. It allows traders to determine strength in a move, determine probable overextended market conditions, and more. But one of its uses that is not usually utilized is in finding divergences, which we would be exploring in this strategy.
Hidden Divergences – A Higher Probability Entry Point
Divergences are basically discrepancies with regards to the depth of the oscillation of an indicator and price. Price gyrates up and down the graph on a boundless space whereas oscillating indicators gyrate on a much tighter space. This causes the discrepancy between price and an oscillating indicator, even though indicators typically shadow price action.
Divergences usually hint of an impending reversal. This entry on a probable reversal usually means bigger returns if you catch a reversal right from the start.
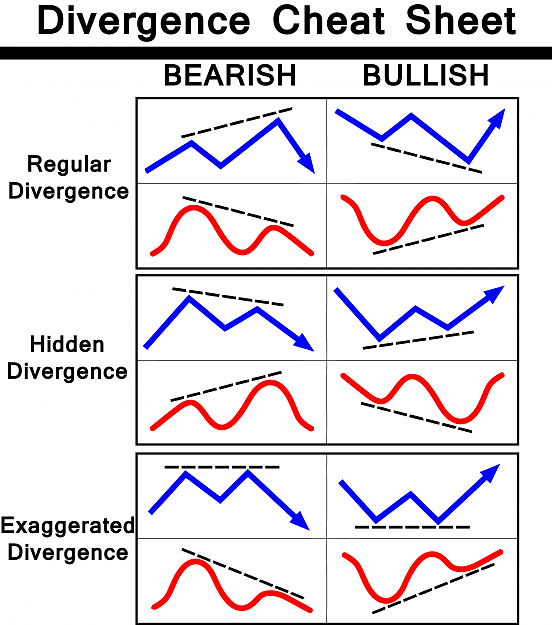
However, different types of divergences differ in the type of reversals where they usually occur. Regular divergences often occur on a bigger picture reversal at the end of an extended trend. Hidden divergences on the other hand typically occur on a retracement. This means that regular divergences could allow traders to rake in big money if it catches the whole new trend after the reversal, but hidden divergences have higher probabilities of success when taken near the start of a fresh trend.
Below is a chart of the different types of divergences. Notice how the hidden divergence is characteristic of a retracement on a trending environment, while regular divergences look more of a full-blown reversal.
Trading Strategy Concept
This strategy is a trend following strategy that has entries on probable retracements based on hidden divergences.
To ensure that we are trading with the trend, we will be using a 50-period Exponential Moving Average (EMA). We will define trend based on where price is in relation to the 50 EMA and on whether it is sloped or flat. A sloppy EMA will usually occur on a trending market environment.
To find our hidden divergences, we will be using a 20-period CCI. This will be our main indicator which we will use to find our entry points.
Take note that retracement entries usually have higher probability near the start of a trend. Entries that surface at an extended trend should be taken with caution.
Indicators:
- 50-period EMA (Gold)
- 20-period CCI
Timeframe: any
Currency Pair: any
Trading Session: any
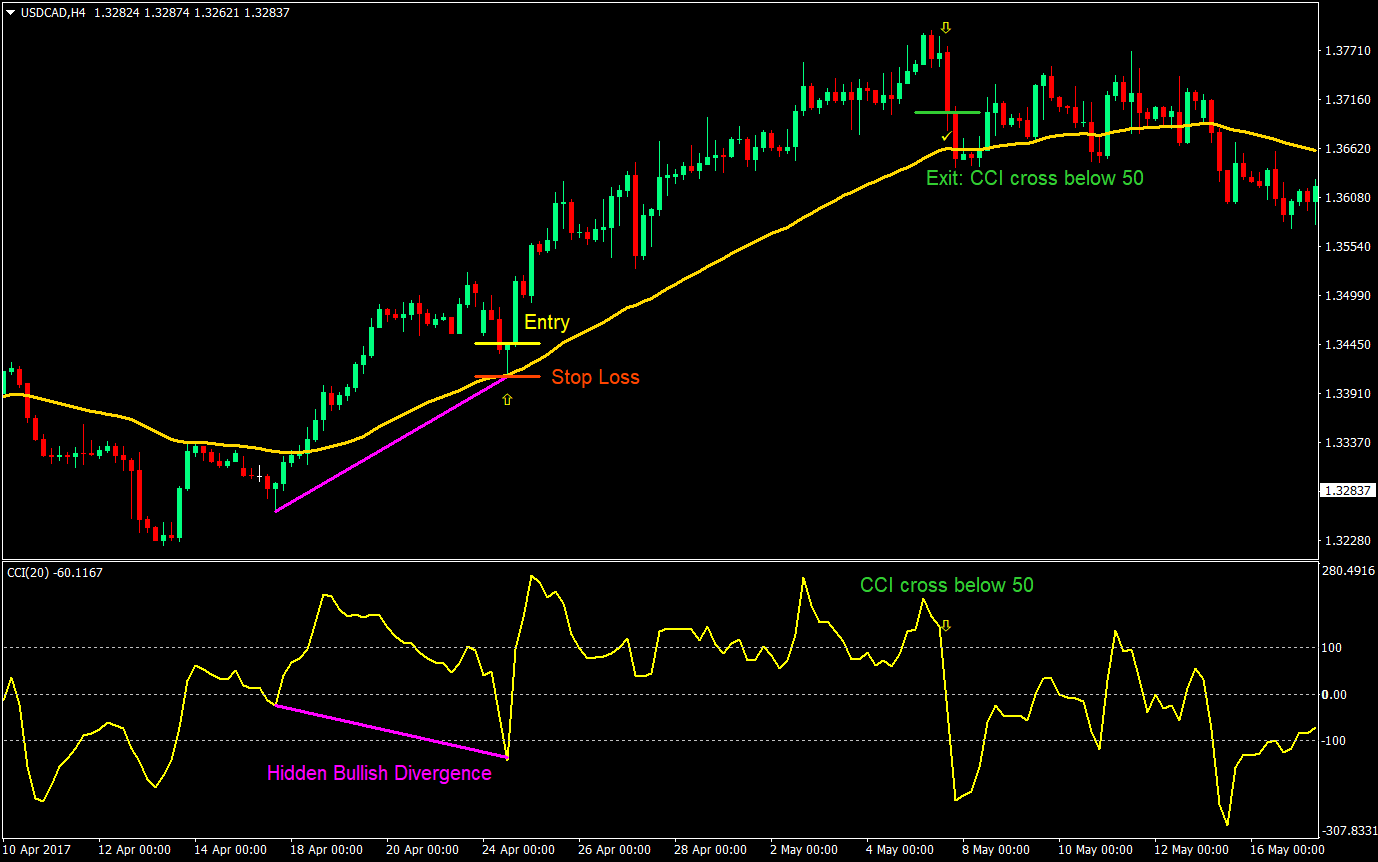
Buy (Long) Trade Setup
Entry
- Price should be above the 50 EMA
- The 50 EMA should be sloping up
- A hidden bullish divergence should be clearly noticeable
- Multiple hidden divergences on one entry point would be better
- A reversal candlestick pattern (pin bars, engulfing patterns, etc.) would yield higher probabilities
- Enter a buy market order on the confluence of the above rules
Stop Loss
- Set the stop loss at the fractal below the entry candle
Exit/Take Profit
- Option 1: Close the trade on the cross of the CCI below 50
- Option 2: Set the take profit target at 2x the risk
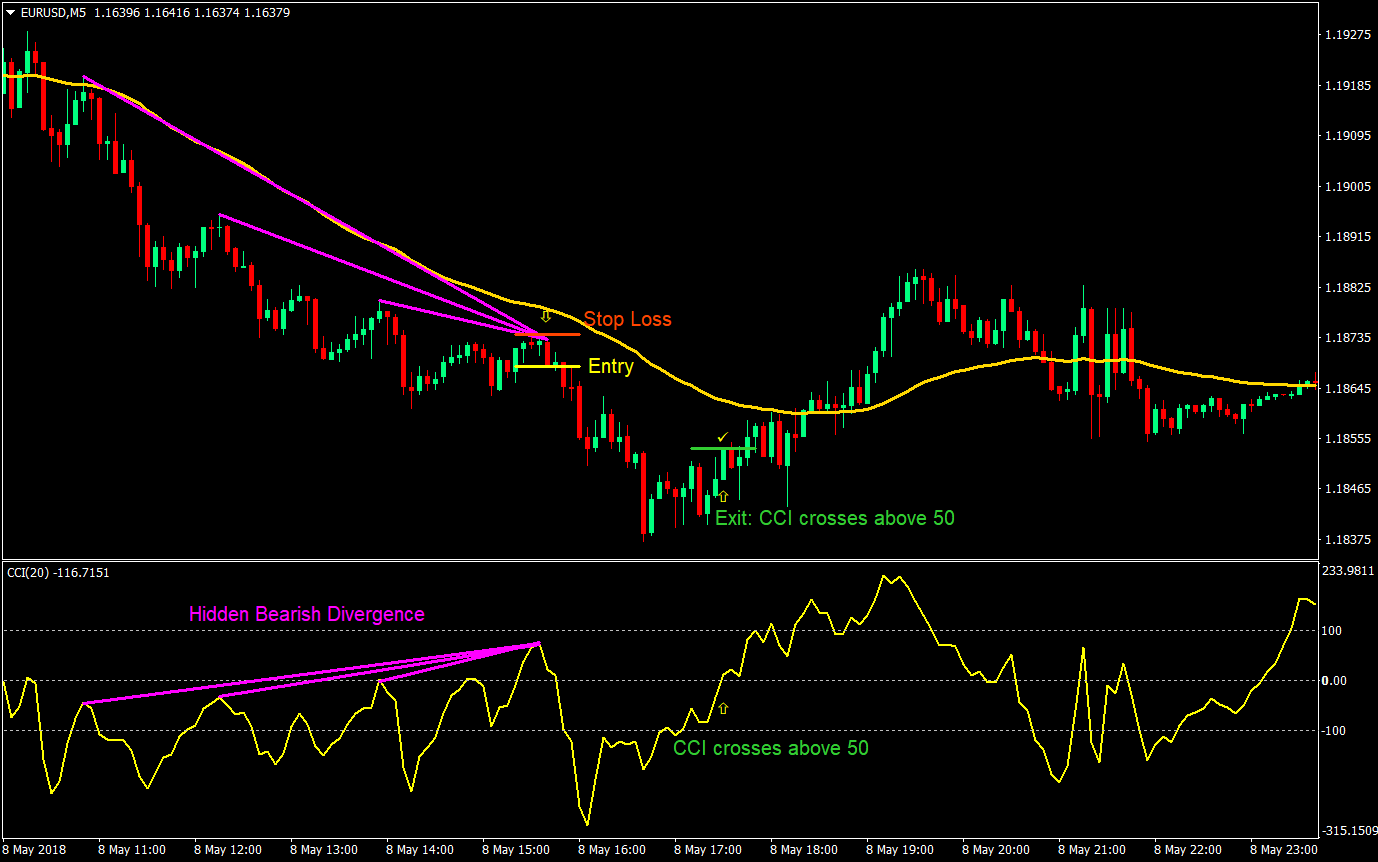
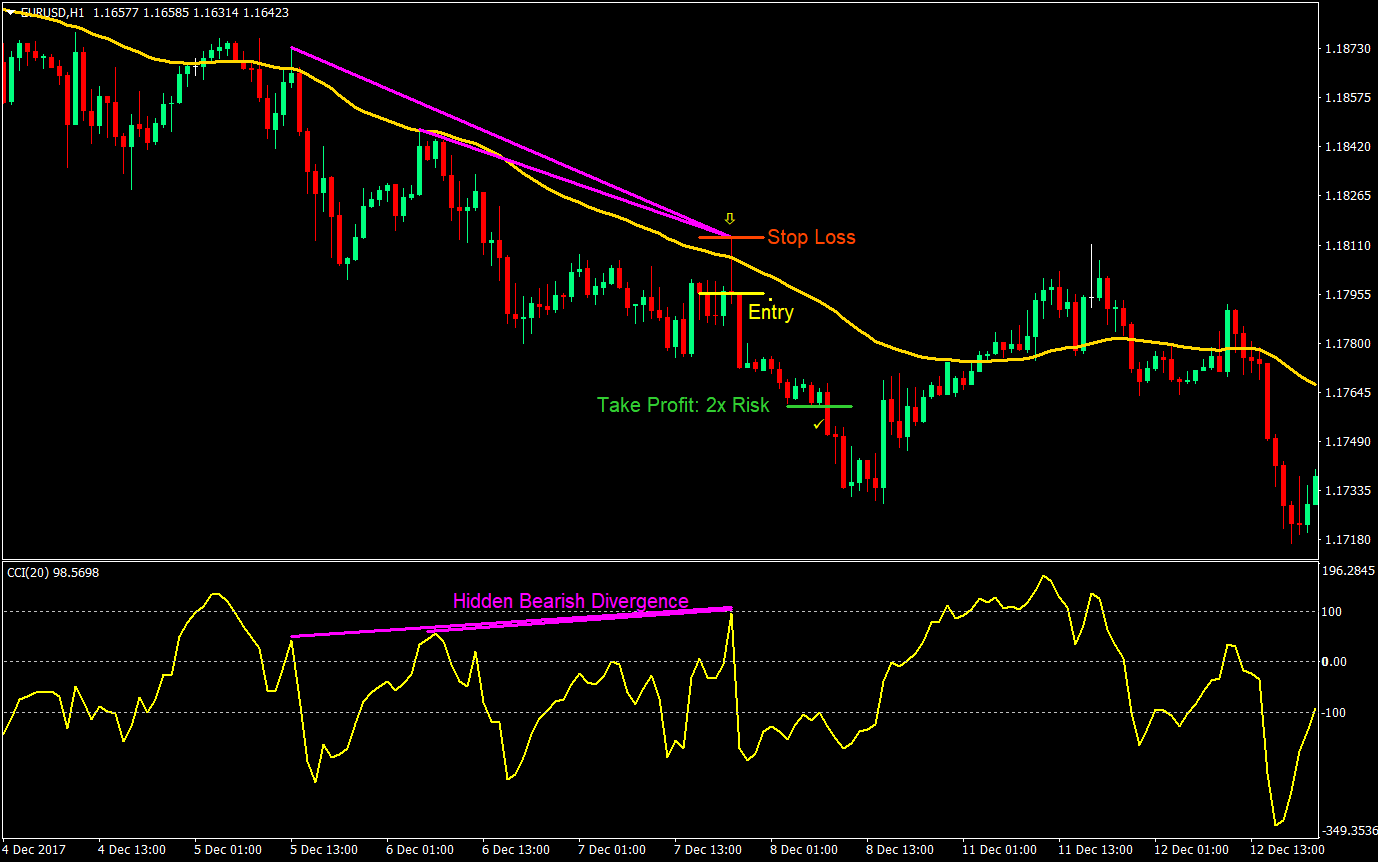
Sell (Short) Trade Setup
Entry
- Price should be below the 50 EMA
- The 50 EMA should be sloping down
- A hidden bearish divergence should be clearly noticeable
- Multiple hidden divergences on one entry point would be better
- A reversal candlestick pattern (pin bars, engulfing patterns, etc.) would yield higher probabilities
- Enter a sell market order on the confluence of the above rules
Stop Loss
- Set the stop loss at the fractal above the entry candle
Exit/Take Profit
- Option 1: Close the trade on the cross of the CCI above 50
- Option 2: Set the take profit target at 2x the risk
Conclusion
This strategy is a great trend continuation strategy or one which could be used in combination with other trend continuation strategies.
The key to this strategy is to have a feel on whether the trend is already overextended or not. Divergences that occur near the start of the trend have greater chances of success. The odds diminish the longer the trend is or the more the retraces are.
If you are able to catch one at the start of a trend, try to ride it all the way down. Aside from the exit strategies above, you could also employ some form of trailing stop to allow you to catch a big chunk of the wave.
This strategy is not the Holy Grail but if practiced and mastered it could yield good results.
Recommended MT4 Broker
- Free $50 To Start Trading Instantly! (Withdrawable Profit)
- Deposit Bonus up to $5,000
- Unlimited Loyalty Program
- Award Winning Forex Broker
- Additional Exclusive Bonuses Throughout The Year

>> Claim Your $50 Bonus Here <<
Click here below to download: