


Trend continuation strategies are one of the easiest types of strategies to trade which can produce consistent results. This is because trading with the trend usually means a higher win probability on each trade.
There are a couple of ways to trade trend continuation strategies. One is by trading on the pullbacks, while the other is by trading on the momentum signals in the direction of the trend. This strategy uses elements of each – waiting for pullbacks while using momentum as the entry trigger.
CCI Averages – Pre-Filtered Indicator
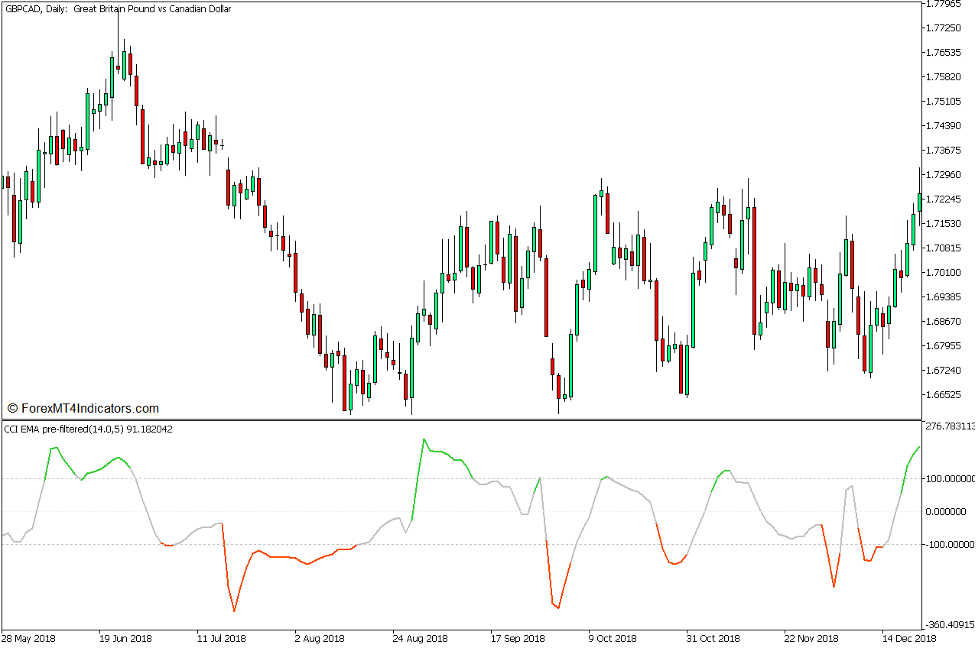
The CCI Averages – Pre-Filtered Indicator is a modification of the Commodity Channel Index (CCI) with a smoothening element to its oscillations.
The classic Commodity Channel Index is a decent oscillator used to identify momentum, trend, and overbought or oversold market levels by comparing the current price and the historical average. Although the classic CCI is a decent oscillator, it does have a weakness which is its susceptibility to false signals. The classic CCI is a very responsive oscillator, which is why it plots a line which can be very jagged and erratic at times. This causes the CCI line to be very susceptible to false signals due to price spikes and market noise.
The CCI Averages – Pre-Filtered Indicator modifies the classic CCI in order to eliminate its erratic oscillations by adding a smoothening factor to it. However, instead of using the common route which is to smoothen the oscillator line by converting it to a moving average, this indicator reverses this procedure. Instead, it first calculates for a short-term moving average of price. Then, it calculates for the CCI of the moving average line. In effect, it is calculating for a smoothened input of price on the CCI formula.
For this approach to work, the moving average should be set as a very fast moving average. This indicator is preset to use a 5-bar Exponential Moving Average (EMA). However, these variables can be modified within the settings.
This indicator also has markers at levels -100 and 100. The oscillator line typically plots a silver line whenever it is within the -100 to 100 range. It then changes to orange red whenever the line drops to below -100. Inversely, it changes to lime green whenever the line breaches above 100.
Users may interpret a bullish momentum whenever the line breaches above the 100 marker, and a bearish momentum whenever the line drops below the -100 marker.
Bollinger Bands
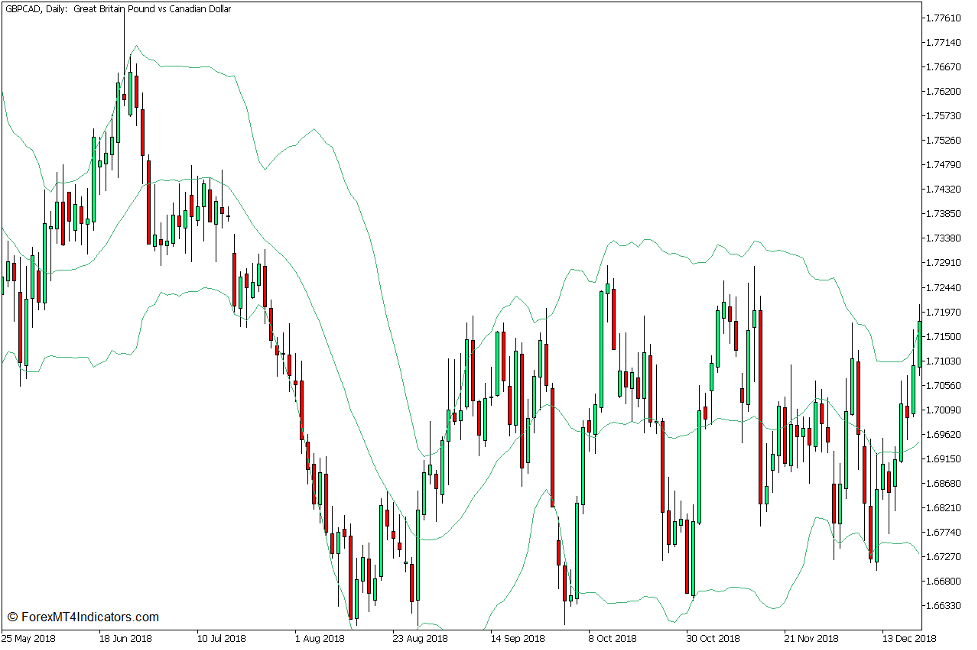
The Bollinger Bands is a versatile technical indicator which can be used to indicate volatility, trend, momentum, as well as overbought and oversold price levels.
The Bollinger Bands plots three lines which tend to wrap around price action. The middle line is a Simple Moving Average (SMA) which is typically preset at 20 bars. The outer lines are standard deviations shifted above and below the middle line, which are usually preset at two standard deviations. These three lines create a channel or band-like structure which envelopes price.
The Bollinger Bands can be used to identify trend direction. Price action typically stays on the half of the Bollinger Bands where the market is trending towards.
Since this indicator is based on standard deviations, it can also be used to identify volatility. The bands contract whenever the market is in a market contraction phase and expand when the market is in a market expansion phase.
The Bollinger Bands is also widely used as an oversold and overbought marker. Price action dropping below the lower line is indicative of an oversold market, while price action breaching above the upper line is indicative of an overbought market, both of which are prime conditions for a mean reversal.
Inversely, the same outer lines can also be used to identify momentum breakouts which occur after a market contraction phase. A momentum candle closing outside the Bollinger Bands right after a market contraction phase indicates a possible momentum breakout scenario.
Trading Strategy Concept
CCI Averages Dynamic Trend Continuation Forex Trading Strategy for MT5 trades a trend continuation setup confirmed by a momentum signal.
The Bollinger Bands indicator is used to identify and confirm the trend direction. This is based on which half of the Bollinger Bands price action generally is. Trades are then taken exclusively in the direction of the trend as indicated by the Bollinger Bands.
The CCI Averages – Pre-Filtered Indicator on the other hand is used to confirm recurrence of the momentum swing. This is based on the oscillator line breaching the -100 to 100 range in the direction of the trend. This would serve as the trade entry trigger.
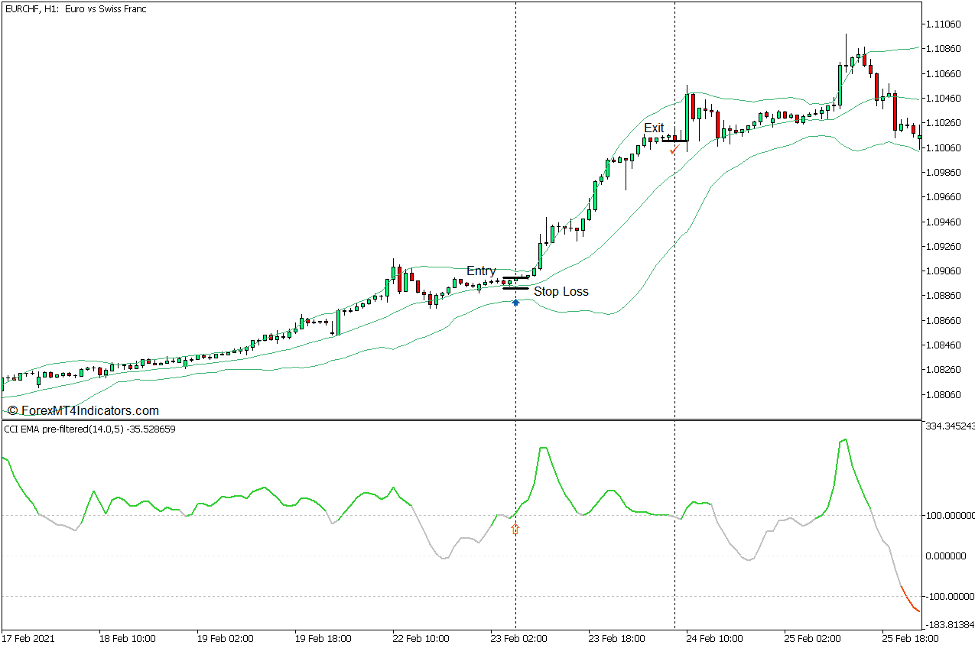
Buy Trade Setup
Entry
- Price action should generally stay above the middle line of the Bollinger Bands.
- Price action should retrace towards the area of the middle line.
- Open a buy order as soon as the CCI Averages – Pre-Filtered oscillator line breaches above 100 and changes to lime green.
Stop Loss
- Set the stop loss on the support below the entry candle.
Exit
- Close the trade as soon as the CCI Averages – Pre-Filtered oscillator line drops back below 100 and changes to silver.
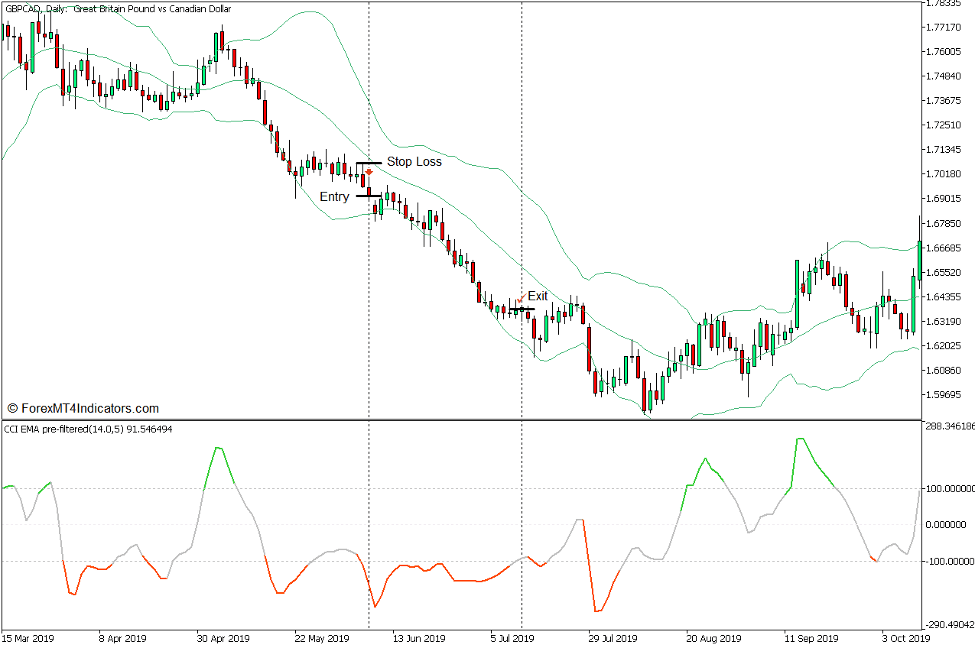
Sell Trade Setup
Entry
- Price action should generally stay below the middle line of the Bollinger Bands.
- Price action should retrace towards the area of the middle line.
- Open a sell order as soon as the CCI Averages – Pre-Filtered oscillator line drops below -100 and changes to orange red.
Stop Loss
- Set the stop loss on the resistance above the entry candle.
Exit
- Close the trade as soon as the CCI Averages – Pre-Filtered oscillator line breaches back above -100 and changes to silver.
Conclusion
This trading strategy is a decent trend continuation strategy which trades trend continuation signals using the CCI Averages – Pre-Filtered Indicator.
The signals produced by this strategy has the potential to result in a high yielding trade relative to the risk on the stop loss. This may allow for a decent risk reward ratio when trades are managed correctly.
However, not all trades would result in a profit. There are some trade signals wherein price action would immediately reverse and result in a loss. To increase the probability of a winning trade, traders should visually observe the characteristics of the market, whether it is indeed trending or not. Trade signals developing on an overextended trade should also be avoided as these trade signals typically have a lower probability of resulting in huge returns.
Recommended MT5 Brokers
XM Broker
- Free $50 To Start Trading Instantly! (Withdraw-able Profit)
- Deposit Bonus up to $5,000
- Unlimited Loyalty Program
- Award Winning Forex Broker
- Additional Exclusive Bonuses Throughout The Year

>> Sign Up for XM Broker Account here <<
FBS Broker
- Trade 100 Bonus: Free $100 to kickstart your trading journey!
- 100% Deposit Bonus: Double your deposit up to $10,000 and trade with enhanced capital.
- Leverage up to 1:3000: Maximizing potential profits with one of the highest leverage options available.
- ‘Best Customer Service Broker Asia’ Award: Recognized excellence in customer support and service.
- Seasonal Promotions: Enjoy a variety of exclusive bonuses and promotional offers all year round.

>> Sign Up for FBS Broker Account here <<
Click here below to download: