


Trading the forex market is often very confusing. People who are new to trading would often get confused whenever see a price chart. Most would think that price charts are meaningless movements of bars and candles going across a chart, moving up and down randomly. Many seasoned traders would also feel this way at times especially when the market is not showing any clear direction.
It is partially true that the market moves randomly. Price movements are based on sentiments and beliefs of each trader regarding price. If a trader believes that price is already too high and could reverse, and if the trader acts on this belief and takes a sell trade, this action contributes to price being pushed lower. Inversely, if another trader thinks price is going up and acts on it, then price would be pushed higher. Predicting the thoughts and beliefs of millions of traders and market participants is impossible. The only way to accurately predict the exact movement of price is if you know what each trader is thinking.
Although it is impossible to predict how each trader thinks, it is possible to have a good estimate regarding what the crowd is thinking. This is called a market sentiment. If bulk of the market is bullish, the market would most likely go up. If the crowd is bearish, then price would most likely be pushed lower.
Bulls Bears Power Forex Trading Strategy is a strategy that incorporates the sentiment of the market in its trade setup. It makes use of a couple of indicators to help traders identify which trade direction to take in order to have a higher probability trade.
Bulls Bears Power
Bulls Bears Power is a custom indicator designed to help traders identify the general sentiment of the market. It is based on a mathematical computation of historical price movements, which were the most recent actions taken by a big chunk of the market.
Bulls Bears Power is displayed as an oscillator. It plots histogram bars that could be either positive or negative. Positive bars indicate a bullish market bias, while negative bars indicate a bearish market bias. Positive bars are painted green, while negative bars are painted red.
This indicator can be used both as a market bias filter or an entry signal. As a filter, traders could avoid taking trades that go against the general bias of the market by looking at the color of the histogram bars. Traders could also use the changing of the color of the bars or the shifting of the bars over zero as an entry signal based on a potential trend reversal.
Chandelier Stops v1
One way to identify a potential trend reversal is by identifying if price has moved against the current trend direction by a magnitude greater than a certain multiple of the Average True Range (ATR). Some traders believe that the trend is reversing if price has reversed by more than twice or thrice the current ATR. This is because price should move within a certain range and candles should average a certain range. If price moves in one direction more than the current average, then the market is trending. If price moves against the current trend more than the average range, then the market trend is reversing.
This concept is the basis of the Chandelier Stops v1 indicator. It identifies the current trend direction and plots a line opposite the current trend based on a multiple of the ATR. If the trend is bullish, it plots a blue line below price action. If the trend is bearish, it plots a red line above price action. If price breaches and closes beyond these lines, the market trend could be reversing.
Trading Strategy
This trading strategy is a momentum trading strategy that filters out momentum signals that go against the current trend and market bias.
The Bears Bulls Power indicator is used to identify the market sentiment. This is based on whether the bars are positive or negative.
The Chandelier Stops v1 indicator is used to identify trend direction. This is simple based on where the line is in relation to price action, as well as the color of the line.
Once the trend bias and market sentiment bias is in confluence, we then wait for a momentum candle to form in the direction of the trend and market sentiment bias.
Indicators:
- ChandelierStops_v1
- Bear_Bulls_Power
Preferred Time Frames: 30-minute, 1-hour and 4-hour charts
Currency Pairs: FX majors, minors and crosses
Trading Sessions: Tokyo, London and New York sessions
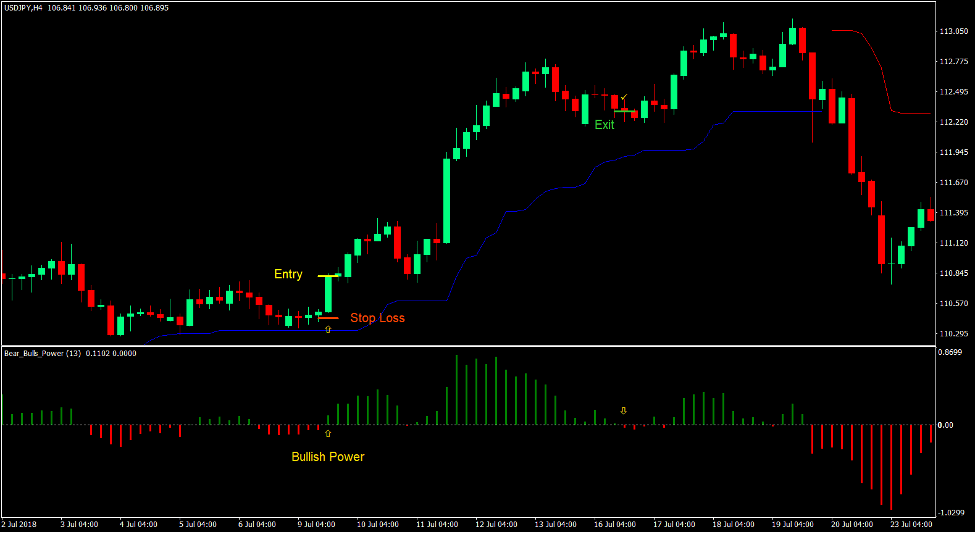
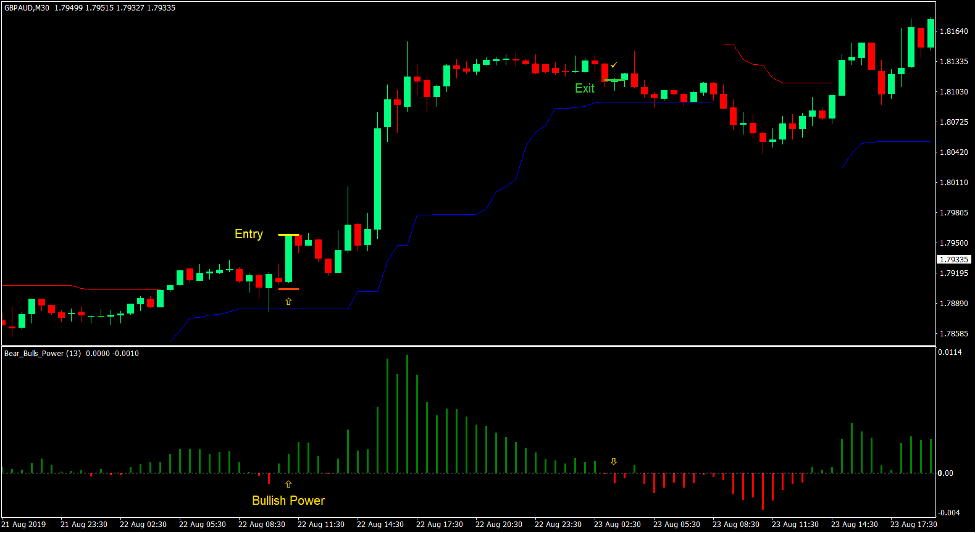
Buy Trade Setup
Entry
- Price action should be above the blue line of the Chandelier Stops v1 indicator.
- The Bulls Bears Power indicator should be printing positive bars.
- A strong bullish momentum candle should be formed.
- Enter a buy order upon confirmation of these conditions.
Stop Loss
- Set the stop loss a few pips below the entry candle.
Exit
- Close the trade as soon as the Bulls Bears Power bars become negative.
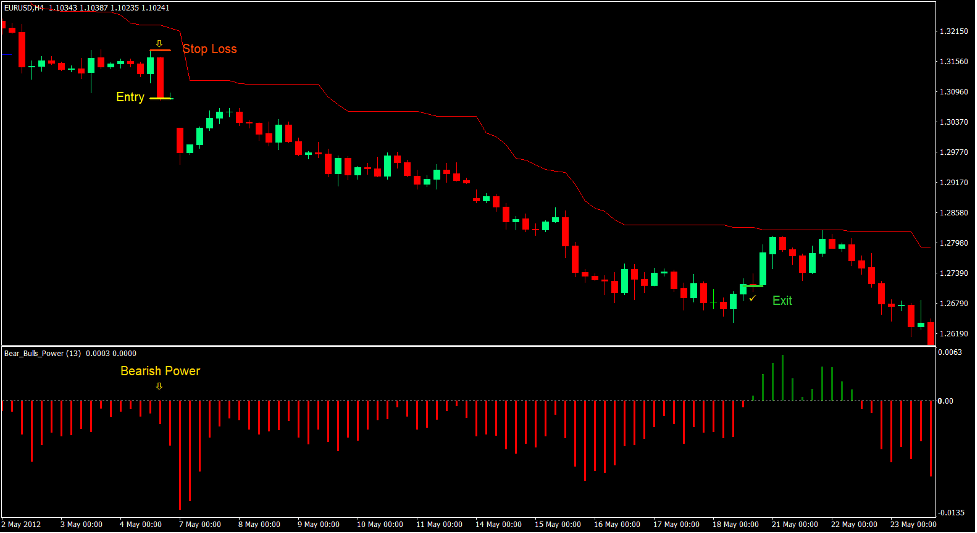
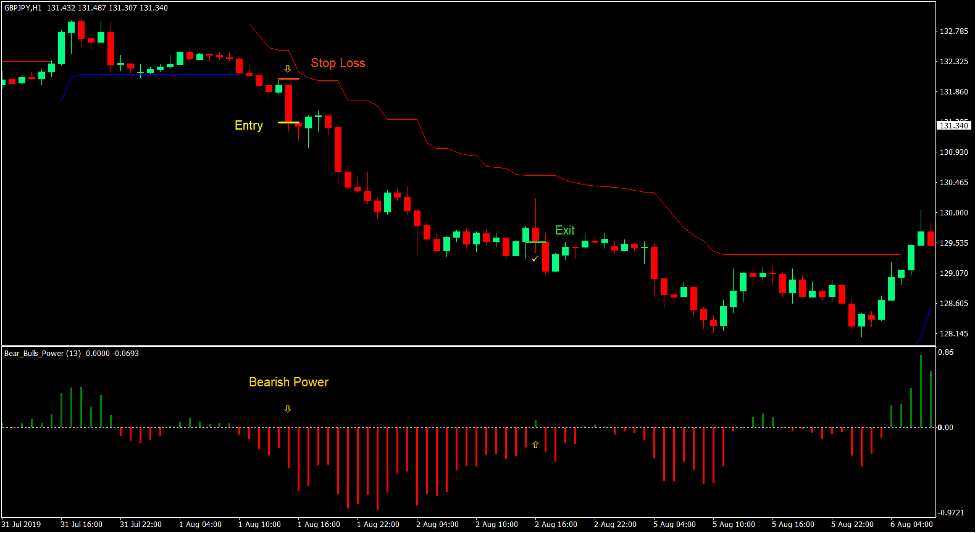
Sell Trade Setup
Entry
- Price action should be below the red line of the Chandelier Stops v1 indicator.
- The Bulls Bears Power indicator should be printing negative bars.
- A strong bearish momentum candle should be formed.
- Enter a sell order upon confirmation of these conditions.
Stop Loss
- Set the stop loss a few pips above the entry candle.
Exit
- Close the trade as soon as the Bulls Bears Power bars become positive.
Conclusion
This trading strategy is basically a momentum price action strategy. On its own, momentum price action strategies could be profitable and can produce consistent result on the long run. However, it can also produce low probability trade signals, especially when the direction of the trade is against the established market sentiment or trend.
This strategy simply filters out momentum trade setups that do not align with the current trend and market sentiment bias.
This creates setups which have a relatively higher probability of resulting in a win compared to regular momentum setups.
Traders should still learn and master price action when using this strategy as this is vital in this kind of trading strategy.
Recommended MT4 Brokers
XM Broker
- Free $50 To Start Trading Instantly! (Withdraw-able Profit)
- Deposit Bonus up to $5,000
- Unlimited Loyalty Program
- Award Winning Forex Broker
- Additional Exclusive Bonuses Throughout The Year

>> Sign Up for XM Broker Account here <<
FBS Broker
- Trade 100 Bonus: Free $100 to kickstart your trading journey!
- 100% Deposit Bonus: Double your deposit up to $10,000 and trade with enhanced capital.
- Leverage up to 1:3000: Maximizing potential profits with one of the highest leverage options available.
- ‘Best Customer Service Broker Asia’ Award: Recognized excellence in customer support and service.
- Seasonal Promotions: Enjoy a variety of exclusive bonuses and promotional offers all year round.

>> Sign Up for FBS Broker Account here <<
Click here below to download: