


Trend continuation setups can be traded in conjunction with a momentum breakout setup.
When trading this type of strategy, it is important that we clearly identify the direction of the trend as well as the market contraction phase that occurs prior to most breakouts. We should also identify the support and resistance levels that should be broken through so that we may react more effectively as the momentum breakout setups develop.
This strategy shows how we can trade momentum breakout setups in the direction of the trend using the Bollinger Bands, 50 EMA, and RSI.
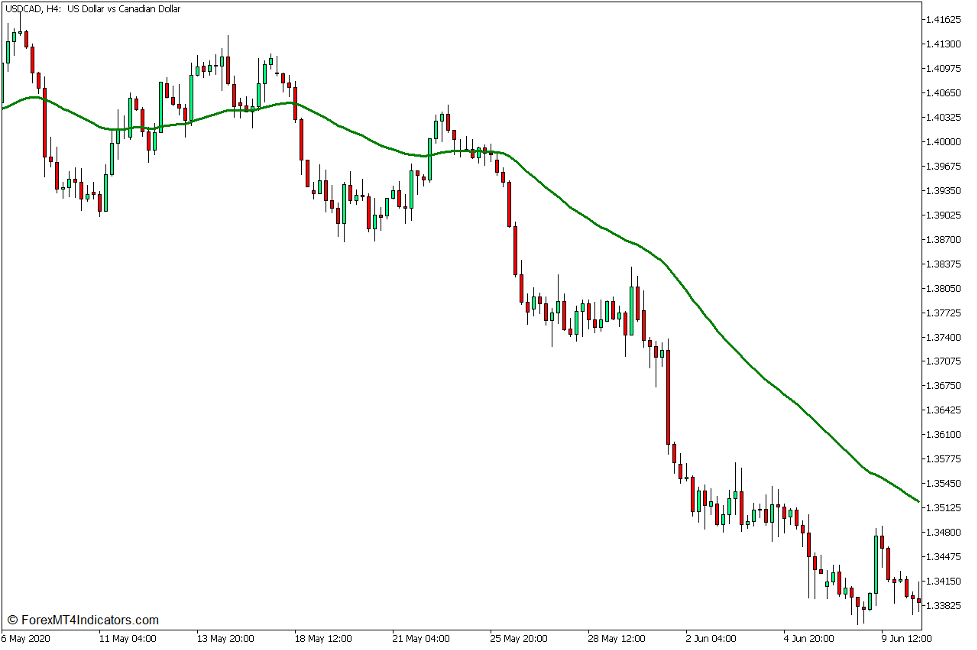
50 Exponential Moving Average
Moving averages are probably the most basic types of technical indicators. They are simple tools traders can use to identify trend directions as well as probable trend reversals.
Traders can easily identify trend direction or trend bias using moving average lines by looking at where price action generally is in relation to the moving average line. Aside from this, moving average lines also tend to slope in the direction of the trend. So, the slope of the moving average line can also visually confirm the trend direction or trend bias identified by the trader.
Certain moving average line periods are more widely used compared to others. Some are generally accepted as an indication of trend direction based on varying time horizons.
The 50-bar moving average is widely accepted as a mid-term trend indicator. In fact, many traders trade exclusively in the direction indicated by the 50 moving average line.
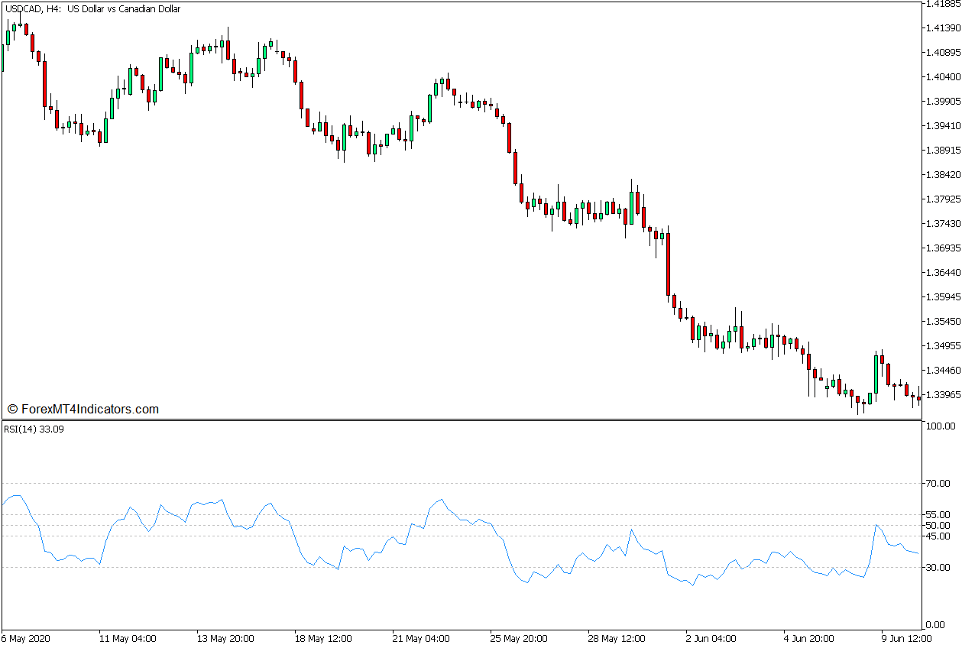
Relative Strength Index
The Relative Strength Index (RSI) is an oscillator type of technical indicator which is very versatile. It is mainly used for identifying overbought and oversold market conditions. However, it can also be used to identify momentum and trend direction.
The RSI plots a line which oscillates within the range of zero to 100. The oscillation of this line is based on average gain and average loss of price based on recent historical price data.
The range of the RSI typically has markers at levels 30 and 70. These markers represent the oversold and overbought levels on the RSI range. An RSI line dropping below 30 is indicative of an oversold market, while an RSI line breaching above 70 is indicative of an overbought market. Both scenarios are prime conditions for a mean reversal. On the other hand, the RSI line may also continue staying beyond the 30 and 70 range whenever momentum is moving strongly in a certain direction. The RSI may continue indicating an oversold or overbought market but this may be due to a strong momentum breakout.
Many traders would also add a marker at level 50. This marker is primarily used as a basis for trend bias. The RSI line typically stays above 50 in an uptrend market and below 50 in a downtrend market. Some traders would also add markers at levels 45 and 55. Level 45 typically acts as a support level for the RSI line in an uptrend market, while level 55 can also act as a resistance level for the RSI in a downtrend market.
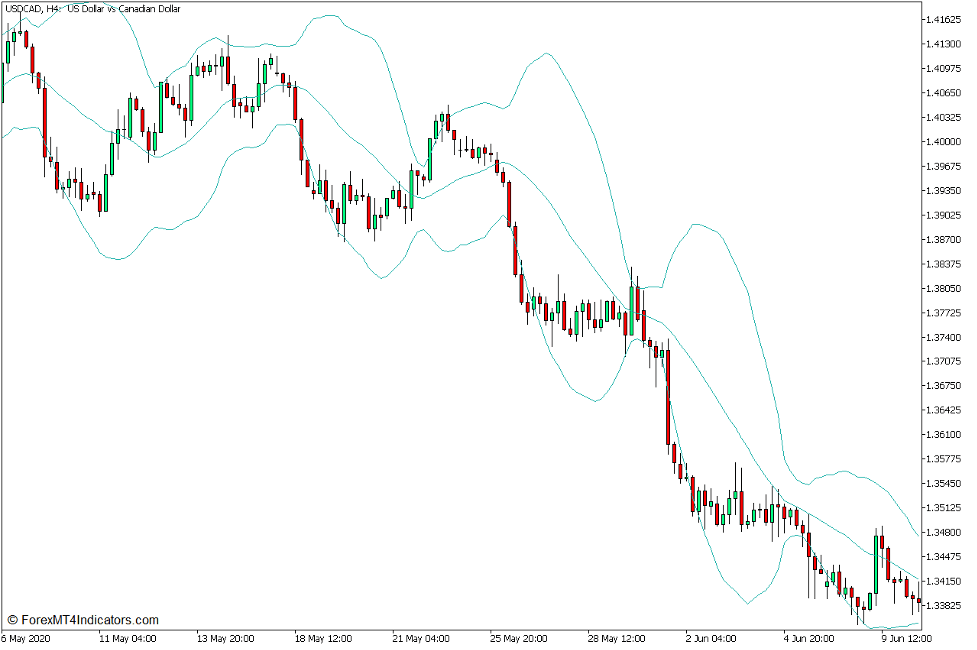
Bollinger Bands
The Bollinger Bands is a technical indicator which can also be used for various purposes. It can indicate trend direction, volatility, momentum, as well as overbought and oversold market conditions.
The Bollinger Bands plots three lines on the price chart. The middle line is a 20-bar Simple Moving Average (SMA) line, while the two outer bars shifted above and below the middle line are standard deviations from the average price.
Since the middle line is a moving average line, the Bollinger Bands can be used as a trend direction indicator just as any moving average line could. Price action generally stays on the upper half of the band in an uptrend market, and on the lower half of the band on a downtrend market.
The outer lines can be used to visually indicate volatility because they are based on standard deviations. The outer bands expand when volatility increases and contracts when volatility decreases.
The outer lines are also mainly used to identify overbought and oversold price levels. The area above the upper line is considered overbought, while the area below the lower line is considered oversold. However, the same outer lines can also be used to identify strong momentum breakouts. The difference between each scenario would be based on how price action forms as price touches the lines. Price rejection occurring at the area of the outer lines is indicative of a probable mean reversal, while strong momentum breakouts beyond the outer lines coming from a low volatility condition is indicative of a probable strong momentum breakout.
Trading Strategy Concept
This trading strategy is a momentum breakout strategy that trades in confluence with the trend using the Bollinger Bands, 50 EMA line, and the RSI.
The 50 EMA line is used as the main trend direction filter. Trades are taken only in the trend direction indicated by the 50 EMA line.
We will use the RSI as another layer of trend confirmation. This will be based on where the RSI line generally is in relation to the markers on levels 45, 50 and 55.
The Bollinger Bands is then used as the basis for identifying momentum breakouts coming from market contraction phases.
Buy Trade Setup
Entry
- The middle line of the Bollinger Bands should be above the 50 EMA line.
- The RSI line should stay above 45.
- The Bollinger Bands should contract.
- Price action should break above the upper Bollinger Bands line and the identified resistance line.
- Enter a buy order on the confirmation of these conditions.
Stop Loss
- Set the stop loss on the support below the entry candle.
Exit
- Close the trade as soon as price action shows signs of a possible bearish reversal.
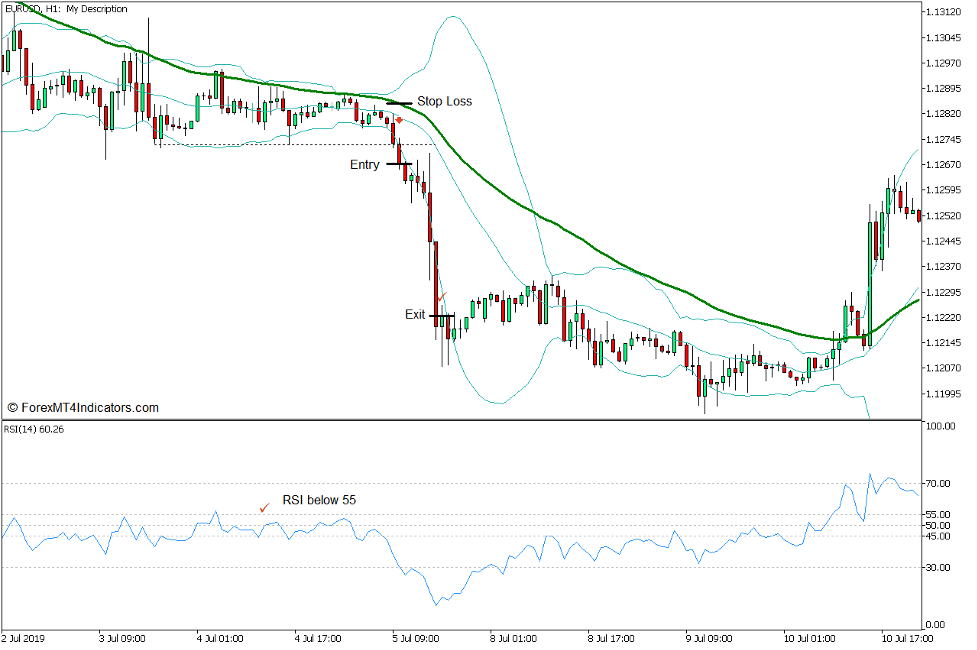
Sell Trade Setup
Entry
- The middle line of the Bollinger Bands should be below the 50 EMA line.
- The RSI line should stay below 55.
- The Bollinger Bands should contract.
- Price action should break below the lower Bollinger Bands line and the identified support line.
- Enter a sell order on the confirmation of these conditions.
Stop Loss
- Set the stop loss on the resistance above the entry candle.
Exit
- Close the trade as soon as price action shows signs of a possible bullish reversal.
Conclusion
Momentum breakout strategies based on the Bollinger Bands is a good momentum breakout setup coming from a market contraction phase. This strategy simply aligns the momentum breakout setup with the trend direction using the RSI and the 50 EMA line.
Recommended MT5 Brokers
XM Broker
- Free $50 To Start Trading Instantly! (Withdraw-able Profit)
- Deposit Bonus up to $5,000
- Unlimited Loyalty Program
- Award Winning Forex Broker
- Additional Exclusive Bonuses Throughout The Year

>> Sign Up for XM Broker Account here <<
FBS Broker
- Trade 100 Bonus: Free $100 to kickstart your trading journey!
- 100% Deposit Bonus: Double your deposit up to $10,000 and trade with enhanced capital.
- Leverage up to 1:3000: Maximizing potential profits with one of the highest leverage options available.
- ‘Best Customer Service Broker Asia’ Award: Recognized excellence in customer support and service.
- Seasonal Promotions: Enjoy a variety of exclusive bonuses and promotional offers all year round.

>> Sign Up for FBS Broker Account here <<
Click here below to download: