The 3 Line Break Indicator is a charting tool used in technical analysis to identify trends in the price of an asset. It is based on the concept of “three-line break” charts, which were first introduced in Japan. The indicator is designed to filter out market noise and focus on the underlying trend of the asset.
Why is it Important?
The 3 Line Break Indicator is important because it helps traders identify trends in the price of an asset. By identifying trends, traders can make more informed trading decisions and improve their overall trading performance.
How Does it Work?
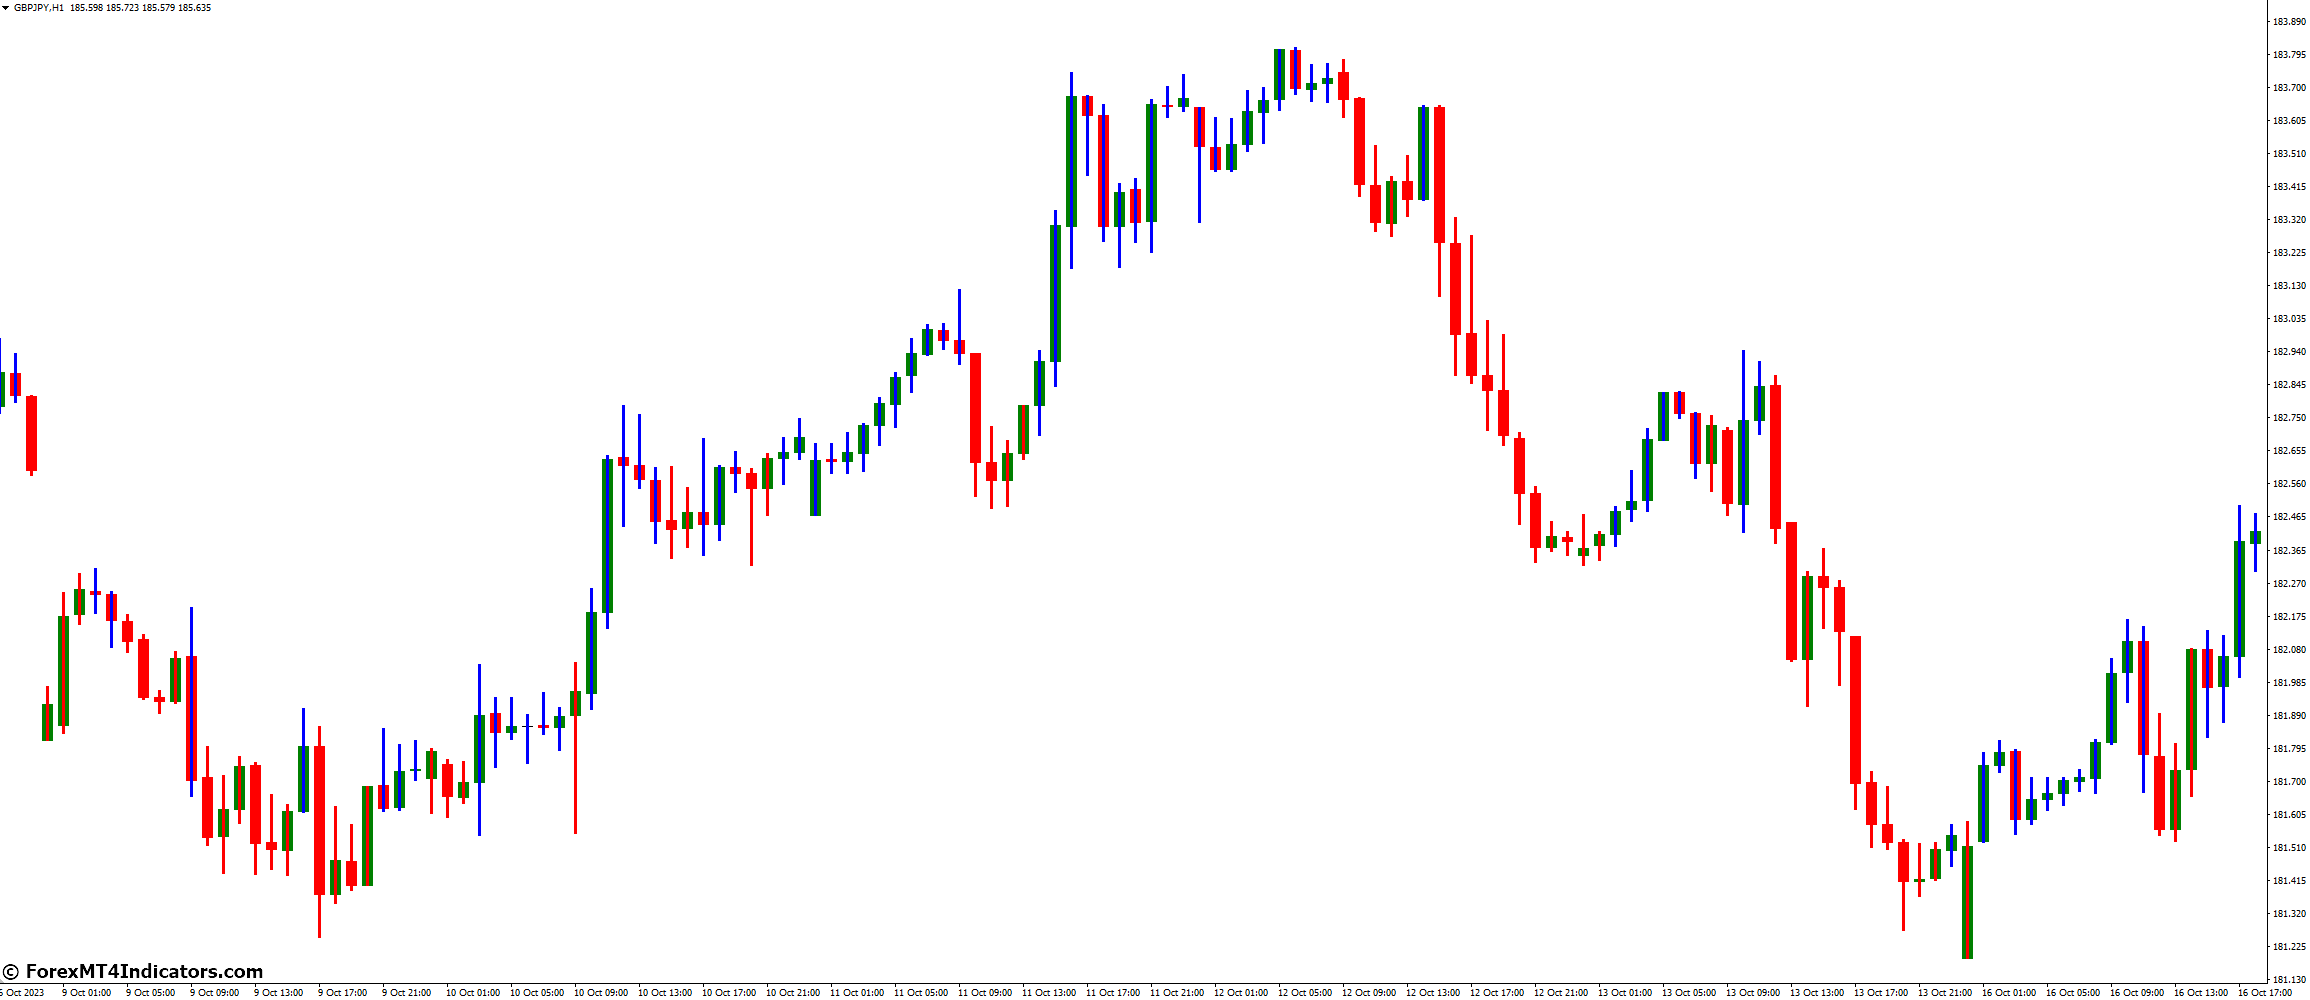
The 3-Line Break Indicator works by plotting a series of vertical lines on the price chart. Each line represents a certain price movement in the asset. When the price moves above or below the previous three lines, a new line is drawn. This helps to filter out market noise and focus on the underlying trend of the asset.
What are the Benefits of Using it?
The benefits of using the 3 Line Break Indicator include:
Identifying trends in the price of an asset
Filtering out market noise
Focusing on the underlying trend of the asset
Improving trading performance
What are the Drawbacks of Using it?
The drawbacks of using the 3 Line Break Indicator include:
It may not work well in choppy or sideways markets
It may generate false signals in certain market conditions
It may not be suitable for all trading styles
How does it Compare to Other Indicators?
The 3 Line Break Indicator is similar to other trend-following indicators such as moving averages and Ichimoku Cloud. However, it is unique in that it filters out market noise and focuses on the underlying trend of the asset.
What are the Best Practices for Using it?
The best practices for using the 3 Line Break Indicator include:
Using it on longer timeframes to filter out market noise
Backtesting the indicator to determine its effectiveness
Using it in conjunction with sound risk management practices
What are the Common Mistakes to Avoid?
The common mistakes to avoid when using the 3 Line Break Indicator include:
Using it as the sole basis for trading decisions
Not using it in conjunction with other technical indicators
Not backtesting the indicator before using it in live trading
Not using sound risk management practices
How to Interpret the Signals?
To interpret the signals of the 3 Line Break Indicator, follow these guidelines:
When the price moves above the previous three lines, a new line is drawn in the opposite direction. This indicates a potential reversal in the trend.
When the price moves below the previous three lines, a new line is drawn in the opposite direction. This also indicates a potential reversal in the trend.
Traders can use the indicator in conjunction with other technical indicators to confirm signals.
Examples
Example 1: Using the 3 Line Break Indicator for trend identification
The 3 Line Break Indicator can be used to identify trends in the price of an asset. Traders can use the indicator to identify the direction of the trend and make trading decisions accordingly. For example, if the indicator shows that the trend is bullish, traders can look for buying opportunities. Conversely, if the indicator shows that the trend is bearish, traders can look for selling opportunities.
Example 2: Using the 3 Line Break Indicator for entry and exit signals
The 3-Line Break Indicator can also be used to generate entry and exit signals. Traders can use the indicator to identify potential entry points when the price breaks above or below the previous three lines. They can also use the indicator to identify potential exit points when the price moves against the trend.
Example 3: Using the 3 Line Break Indicator for risk management
The 3 Line Break Indicator can be used in conjunction with sound risk management practices to minimize losses and maximize profits. Traders can use the indicator to identify potential stop-loss levels and take-profit levels based on the underlying trend of the asset.
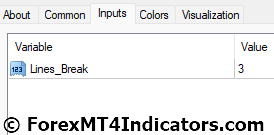
3 Line Break Indicator Settings
Conclusion
The 3 Line Break Indicator for MetaTrader 4 is a powerful tool that can help traders identify trends and potential trading opportunities in the financial markets. By using the indicator in conjunction with other technical indicators and sound risk management practices, traders can improve their overall trading performance and achieve their financial goals.
Recommended MT4/MT5 Brokers
XM Broker
Free $50 To Start Trading Instantly!(Withdraw-able Profit)
To provide the best experiences, we use technologies like cookies to store and/or access device information. Consenting to these technologies will allow us to process data such as browsing behavior or unique IDs on this site. Not consenting or withdrawing consent, may adversely affect certain features and functions.
Functional
Always active
The technical storage or access is strictly necessary for the legitimate purpose of enabling the use of a specific service explicitly requested by the subscriber or user, or for the sole purpose of carrying out the transmission of a communication over an electronic communications network.
Preferences
The technical storage or access is necessary for the legitimate purpose of storing preferences that are not requested by the subscriber or user.
Statistics
The technical storage or access that is used exclusively for statistical purposes.The technical storage or access that is used exclusively for anonymous statistical purposes. Without a subpoena, voluntary compliance on the part of your Internet Service Provider, or additional records from a third party, information stored or retrieved for this purpose alone cannot usually be used to identify you.
Marketing
The technical storage or access is required to create user profiles to send advertising, or to track the user on a website or across several websites for similar marketing purposes.


