


Flytende gennemsnitlige crossover-handelsstrategier er nogle af de mest grundlæggende typer af trendvendende handelsstrategier, som handlende bruger. Faktisk starter de fleste nye handlende ofte med denne grundlæggende handelsstrategi. Selvom denne handelsstrategi er en effektiv måde at identificere potentielle trendvendinger, har den en tendens til at producere falske trendvendingssignaler. Dette er mere tydeligt på markeder, der starter en sidelæns bevægelse i stedet for en egentlig trendvending. Dette resulterer ofte i, at handlende ofte tager tab, når signalerne bruges på et marked, der er meget hakkende eller bevæger sig sidelæns.
Denne handelsstrategi er en modifikation af den grundlæggende crossover-strategi for glidende gennemsnit, som bruger en jævnere glidende gennemsnitslinje, hvilket burde resultere i trendvendende signaler, som kan være mere pålidelige.
YMA glidende gennemsnitsindikator
YMA-indikatoren er en brugerdefineret teknisk indikator udviklet af Yuriy Tokman. Det er en glidende gennemsnitstype indikator, som ændrer den grundlæggende glidende gennemsnitsindikator for at beregne den gennemsnitlige pris baseret på gennemsnitsprisen på et værdipapir inden for hver prisbar.
YMA-indikatoren inkorporerer en formel, der beregner gennemsnittet af de åbne, høje, lave og lukkede værdier for hvert stearinlys. Det tilføjer grundlæggende de fire værdier og dividerer derefter summen med fire. Det resulterende gennemsnit vil derefter blive brugt til at beregne for hvert punkt på den glidende gennemsnitslinje. Denne metode skaber en glidende gennemsnitslinje, som er meget glattere end almindelige glidende gennemsnitslinjer.
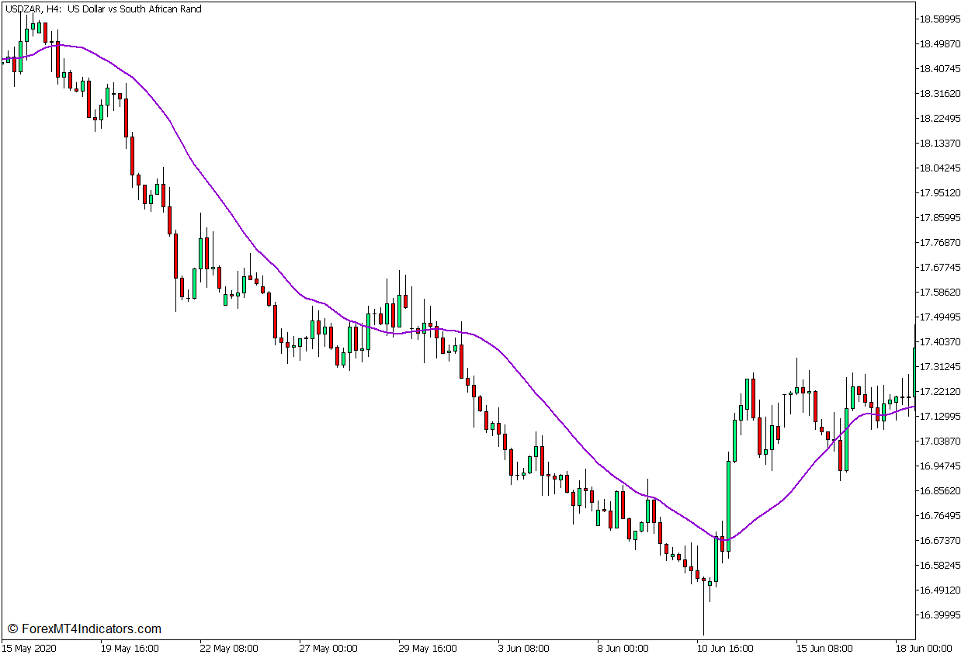 YMA-linjen kan bruges på samme måde som de fleste glidende gennemsnitslinjeindikatorer bruges. Den kan bruges til at bestemme den generelle retning af trenden baseret på, hvor prishandlingen generelt er i forhold til dens linje, såvel som hældningen af dens linje. Området omkring linjen kan også tjene som et dynamisk støtte- eller modstandsområde, hvor prisen kan hoppe fra. Det kan også bruges til at identificere potentielle trendvendende signaler. Dette kan være baseret på prishandling, der bryder gennem linjen eller krydser den. Det kan også være baseret på glidende gennemsnits-crossovers ved at bruge flere YMA-linjer eller parre det med andre glidende gennemsnitslinjer.
Bevægende gennemsnitlig konvergens og afvigelse
Moving Average Convergence and Divergence, også populært kendt som MACD, er sandsynligvis en af de mest udbredte tekniske indikatorer. Det er en oscillatortype af teknisk indikator, som identificerer retningen af kursmomentum baseret på en underliggende beregning af forskellen mellem et par glidende gennemsnitslinjer.
De første data, som MACD-indikatoren beregner for, er forskellen mellem to eksponentielle glidende gennemsnit (EMA). Den plotter derefter de resulterende værdier enten som histogramstænger eller som en oscillatorlinje. De anden data, som den beregner for, er de værdier, der ville plotte signallinjen. Det gør det ved at beregne for det simple bevægelige gennemsnit (SMA) for MACD-linjen eller søjlerne.
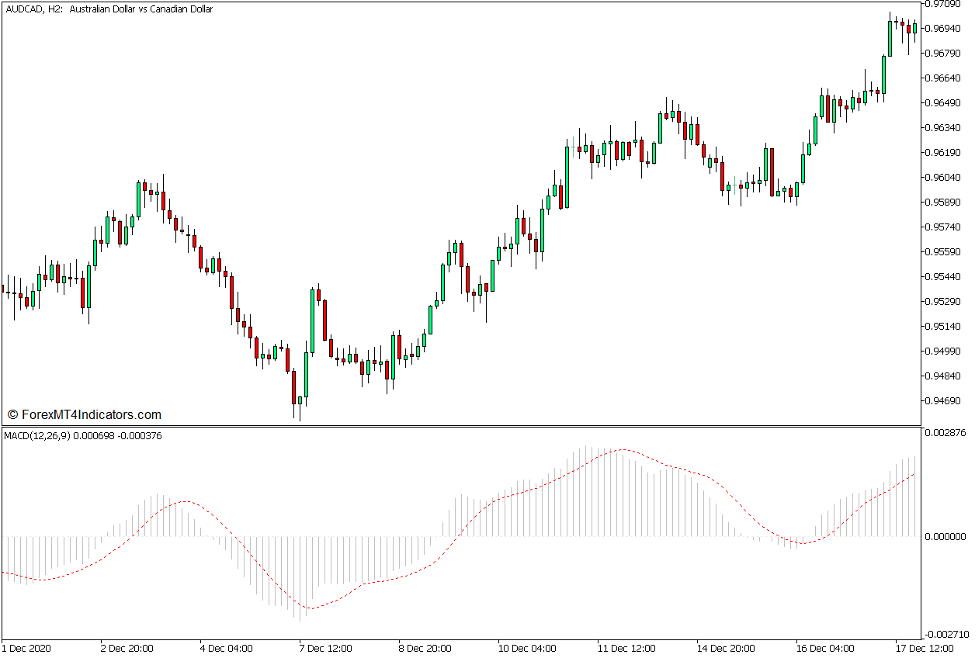
Der er flere måder at fortolke MACD-oscillatoren på. Handlende kan identificere trendbias baseret på, om MACD-stængerne er positive eller negative. Positive værdier indikerer en bullish trendbias, mens negative værdier kan indikere en bearish trendbias. Traders kan også bruge MACD til at identificere momentumretning. Dette er baseret på positionen af MACD-linjen eller stregerne i forhold til signallinjen. Momentum er bullish, når MACD-stængerne er over signallinjen, og bearish, når MACD-stængerne er under signallinjen.
Handelsstrategikoncept
YMA Moving Average Crossover Forex Trading Strategy for MT5 er en trendvendende handelsstrategi, som er baseret på konceptet med glidende gennemsnits-crossovers. Den bruger tre elementer, som er 7-bar YMA-linjen, 21-bar YMA-linjen og MACD.
Skabelonen, der bruges i denne strategi, modificerer en af YMA-linjerne til at beregne glidende gennemsnit baseret på en periode på syv søjler. Vi ville også ændre farven på denne YMA-linje til grøn for lettere identifikation.
Det første trendvendende signal ville være en crossover mellem 7-bar YMA-linjen (grøn) og 21-bar YMA-linjen (violet). Selvom dette er et væsentligt signal, bør det ikke opfattes som et selvstændigt trendvendingssignal.
MACD'en vil derefter blive brugt som en yderligere bekræftelse af trendvending. Dette vil være baseret på skift af MACD-bjælken eller linjeværdien fra positiv til negativ eller omvendt. Trendvendinger bekræftes, når der er et sammenløb mellem krydsningen af de to YMA-linjer og krydsningen af MACD-stængerne over dens midterlinje, som er nul.
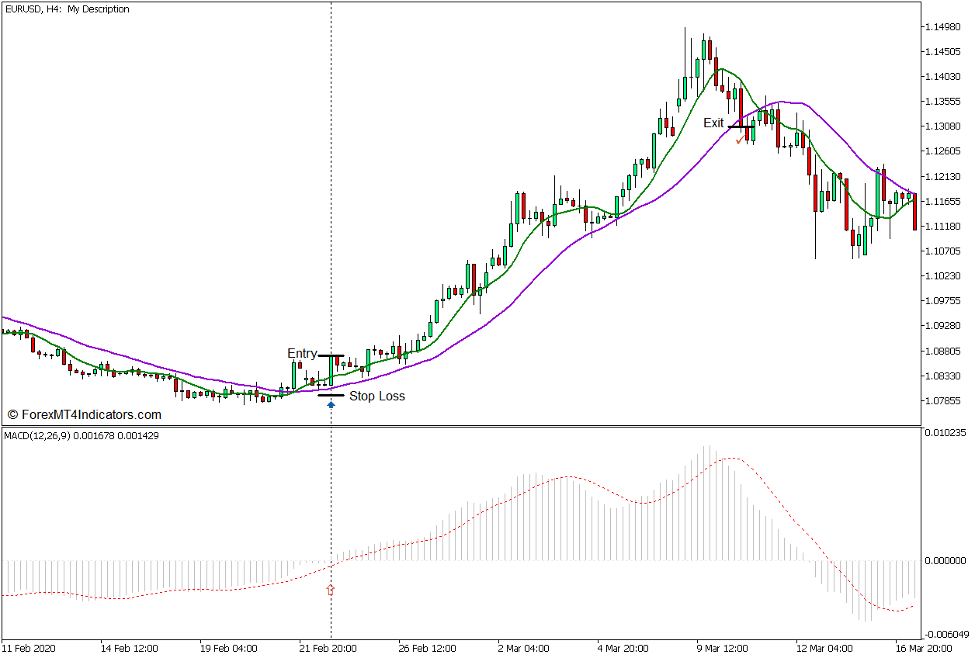
Køb Trade Setup
Indgang
- 7-bar YMA-linjen (grøn) skal krydse over 21-bar YMA-linjen (violet).
- MACD-stængerne skal krydse over nul, der kommer fra en generelt negativ værdi.
- Disse trendvendingssignaler bør være omtrent tæt på hinanden.
- Åbn en købsordre ved sammenløbet af disse to trendvendingssignaler.
Stop Loss
- Indstil stop loss på fraktalen under indgangslyset.
Udgang
- Luk handlen, så snart prisen lukker under 21-bar YMA-linjen.
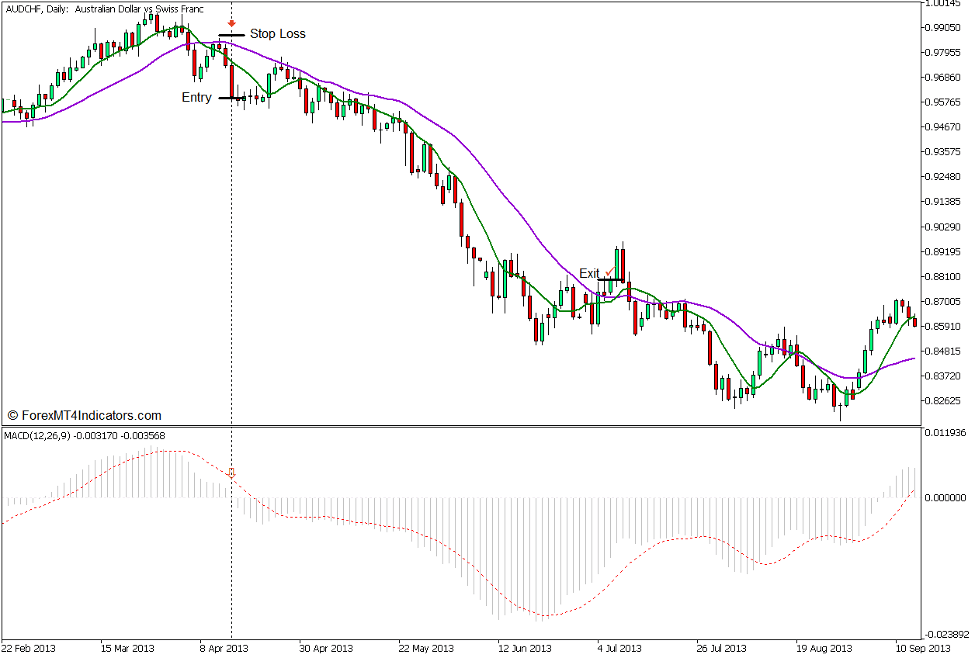
Sælg handelsopsætning
Indgang
- 7-bar YMA-linjen (grøn) skal krydse under 21-bar YMA-linjen (violet).
- MACD-stængerne skal krydse under nul, der kommer fra en generelt positiv værdi.
- Disse trendvendingssignaler bør være omtrent tæt på hinanden.
- Åbn en salgsordre ved sammenløbet af disse to trendvendingssignaler.
Stop Loss
- Indstil stoptabet på fraktalen over indgangslyset.
Udgang
- Luk handlen, så snart prisen lukker over 21-bar YMA-linjen.
Konklusion
Denne strategi ændrer den grundlæggende crossover-strategi for glidende gennemsnit ved at bruge YMA-linjen, som er en glattere version af det grundlæggende glidende gennemsnit. Det tilføjer også MACD som en yderligere bekræftelse, der markant øger sandsynligheden for en rentabel handel.
Handlende, der ville vælge at bruge denne type trendvendingssignal, bør bruge det i forbindelse med prishandlinger, og hvordan det opfører sig i områder nær eller omkring trendvendinger. Dette ville hjælpe dem med at identificere potentielle trendvendinger lettere oven på de objektive trendvendingssignaler, der er diskuteret ovenfor.
Anbefalede MT5-mæglere
XM Broker
- Gratis $ 50 For at begynde at handle med det samme! (Tilbagetrækbar fortjeneste)
- Indbetalingsbonus op til $5,000
- Ubegrænset loyalitetsprogram
- Prisvindende Forex Broker
- Yderligere eksklusive bonusser Gennem året

>> Tilmeld dig XM Broker-konto her <
FBS mægler
- Handel 100 bonus: Gratis $100 for at kickstarte din handelsrejse!
- 100% indbetalingsbonus: Fordoble dit indskud op til $10,000, og handel med øget kapital.
- Udnyttelse op til 1: 3000: Maksimering af potentielle overskud med en af de højeste gearingsmuligheder, der findes.
- Prisen 'Bedste kundeservicemægler Asia': Anerkendt ekspertise inden for kundesupport og service.
- Sæsonbestemte kampagner: Nyd en række eksklusive bonusser og kampagnetilbud hele året rundt.

>> Tilmeld dig FBS Broker-konto her <
Klik her nedenfor for at downloade: