


Trendende markeder kan give fremragende handelsmuligheder, fordi det er nemt at identificere retningen, hvor markedet bevæger sig. Handlende skal blot identificere trendens retning og handle i den retning. Efter at have gjort det, bør handlende derefter identificere det indgangsniveau, hvor de ønsker at åbne en handel. Pullbacks er gode muligheder, da det giver handlende mulighed for at komme ind på et trending marked til et næsten optimalt prisniveau. Denne handelsstrategi viser os, hvordan vi kan handle tilbagetrækninger på et trendmarked ved hjælp af RSI of MACD Double-indikator.
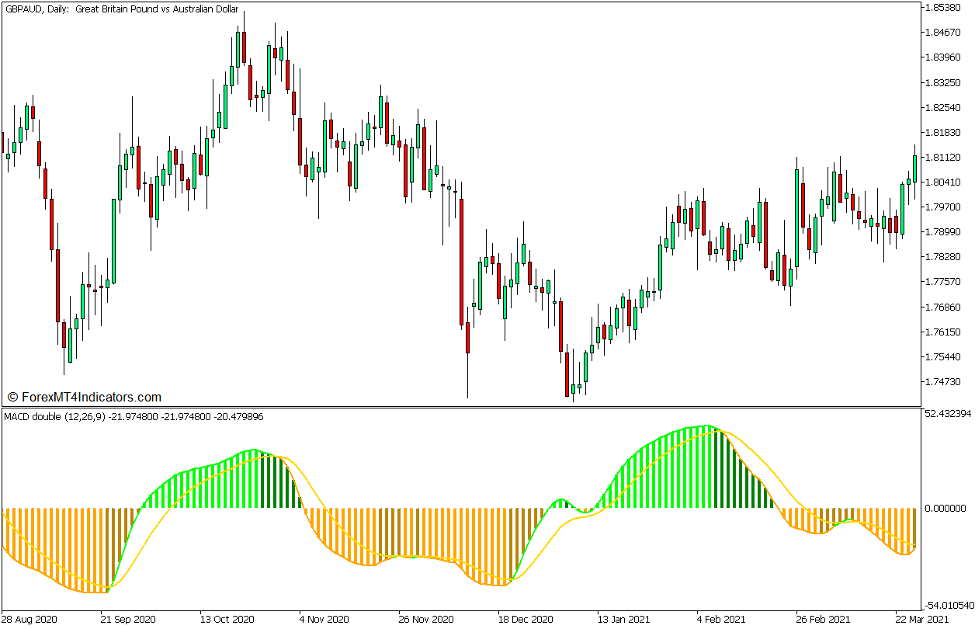
RSI af MACD dobbelt indikator
RSI for MACD Double Indicator er en brugerdefineret indikator, som er afledt af Relative Strength Index (RSI) og Moving Average Convergence and Divergence (MACD).
RSI er en klassisk oscillatortype indikator, som bruges til at hjælpe handlende med at identificere momentumretning. Den måler markedets momentum ved at beregne størrelsen af de seneste prisændringer. Det kan også bruges til at identificere overkøbte og oversolgte markeder baseret på dens oscillatorlinje, der når den øvre eller nedre ende af dens rækkevidde.
MACD på den anden side er også en momentumindikator, som præsenterer trendretning ved at beregne forskellen mellem to EMA-linjer (Exponential Moving Average). Forskellen mellem de to underliggende EMA-linjer bruges til at plotte MACD-linjen eller histogramstængerne. Den beregner også det simple bevægelige gennemsnit (SMA) for MACD-linjen, hvis resultat er plottet som en signallinje, der følger bevægelserne af MACD-hovedlinjen.
RSI for MACD Double Indicator er en modificeret version af MACD. I stedet for at bruge den grundlæggende lukkekurs for hver søjle, bruger denne indikator en underliggende RSI-beregning til at beregne sin MACD-linje. På en måde er det en MACD afledt af RSI. Den beregner for to EMA-linjer baseret på RSI, hvis resultat bruges til at plotte dens MACD-linje. Ligesom med almindelige MACD'er, beregner den også for MACD-linjens SMA, som bliver dens signallinje.
Den plotter også histogramstænger sammen med dens MACD-linje. Disse histogrambjælker skifter farve afhængigt af, om søjlerne er positive eller negative, og om værdierne stiger eller falder. Kalkstænger indikerer positive søjler med stigende værdier, mens grønne søjler indikerer positive søjler med faldende værdier. På den anden side angiver orange søjler negative søjler med aftagende værdier, mens guldstag angiver negative søjler med stigende værdier.
50 Eksponentielt glidende gennemsnit
De fleste glidende gennemsnitslinjer har en tendens til at være for haltende, hvilket får handlende til at træffe handelsbeslutninger lidt for sent. Af denne grund har handlende undersøgt efter måder at reducere forsinkelsen af glidende gennemsnitslinjer.
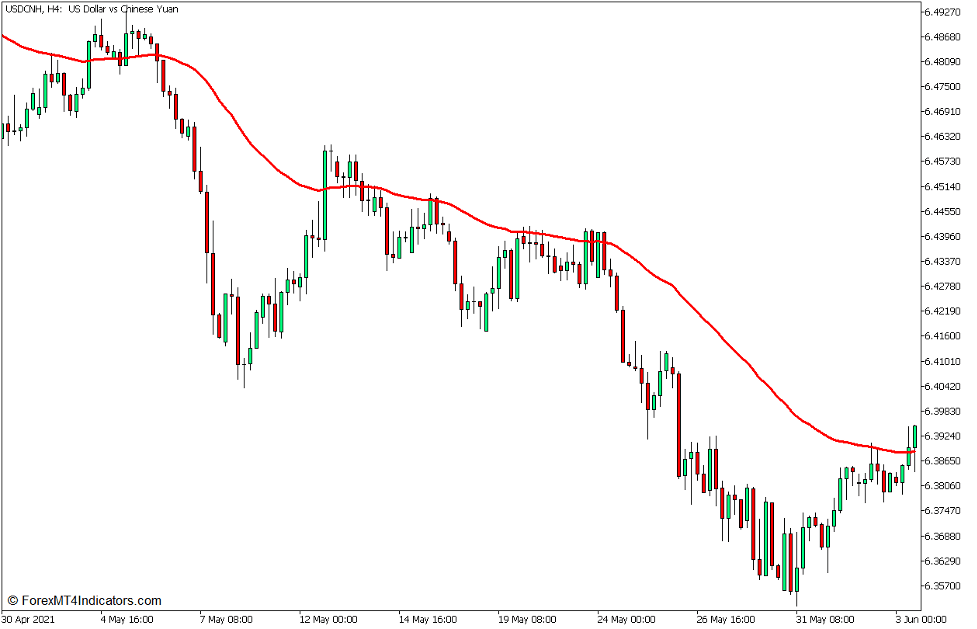
Et eksponentielt glidende gennemsnit (EMA) er en type glidende gennemsnitslinje, som lægger mere vægt på nyere prisdata i forhold til de foregående historiske prisdata. Ved at gøre det skaber EMA en glidende gennemsnitslinje, som har mindre forsinkelse sammenlignet med den grundlæggende glidende gennemsnitslinje, hvilket gør den mere lydhør over for trend- og momentumvendinger og svingninger, samtidig med at den bevarer sin glathed.
50-bar EMA-linjen er meget udbredt som en glidende gennemsnitslinje på mellemlang sigt. Handlende identificerer ofte den generelle trendretning baseret på den generelle placering af prishandling i forhold til 50 EMA-linjen. Det følger også, at trendretningen også kan identificeres ud fra hældningen af 50 EMA-linjen, uanset om den hælder opad eller nedad.
50 EMA-linjen kan også bruges som et dynamisk område for støtte eller modstand. Handlende kan bruge området nær 50 EMA-linjen som et støtteområde under en optrend og som et modstandsområde under en nedadgående trend.
Handelsstrategikoncept
RSI af MACD Double Trend Swing Forex Trading Strategy for MT5 er en trendfortsættelsesstrategi, som handler langs et trendmarked, mens det svinger op og ned i prisdiagrammet. Det forsøger at handle i slutningen af en dyb markedstilbagetrækning, som almindeligvis kan observeres som markedsudsving.
50 EMA-linjen bruges hovedsageligt som trendretningsfilter. Dette er baseret på, hvor prishandlingen generelt er i forhold til 50 EMA-linjen, samt linjens hældning.
Det bruges også som et dynamisk område for støtte eller modstand. Området omkring 50 EMA-linjen er, hvor vi kunne forudse tilbagetrækningen af et trendmarked at bevæge sig hen imod og hoppe fra.
RSI for MACD Double-indikatoren bruges som vores handelsindgangssignal, som bør være i overensstemmelse med trendretningen baseret på 50 EMA. Handelsindgangssignalet er baseret på farveændringen af histogramstængerne, som det plotter.
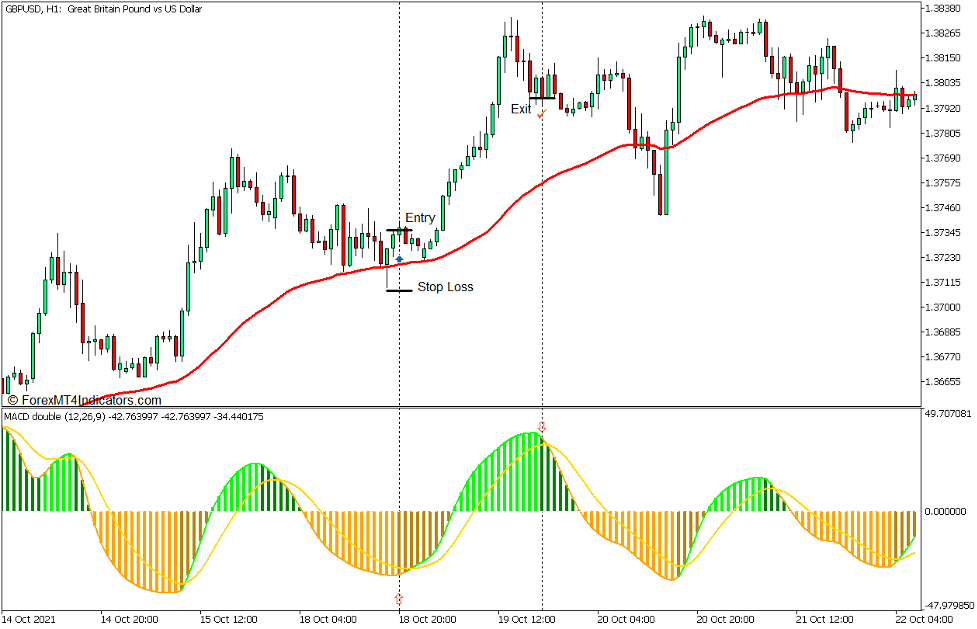
Køb Trade Setup
Indgang
- 50 EMA-linjen bør hælde op, mens prishandlingen generelt er over 50 EMA-linjen.
- Tillad prisen at trække tilbage mod 50 EMA-linjen.
- Åbn en købsordre, så snart RSI for MACD Dobbelt histogramstænger ændres til guldris, hvilket indikerer en bullish momentumvending.
Stop Loss
- Indstil stop loss på fraktalen under indgangslyset.
Udgang
- Luk handelen, så snart RSI for MACD Dobbeltstænger skifter til grøn, hvilket indikerer en mulig bearish momentumvending.
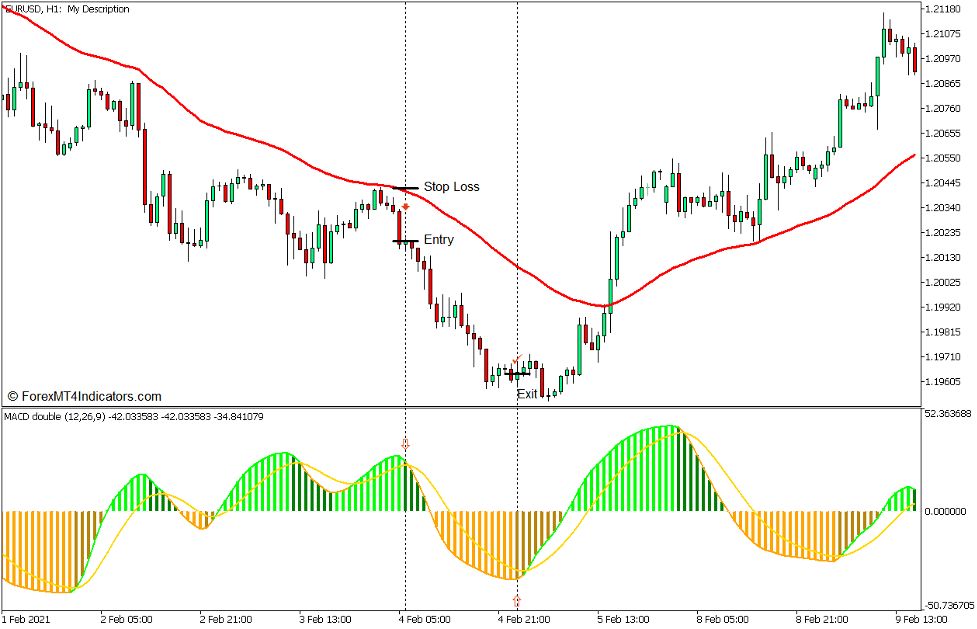
Sælg handelsopsætning
Indgang
- 50 EMA-linjen bør hælde ned, mens prishandlingen generelt er under 50 EMA-linjen.
- Tillad prisen at trække tilbage mod 50 EMA-linjen.
- Åbn en salgsordre, så snart RSI for MACD Double-histogrambjælker skifter til grønt, hvilket indikerer en bearish momentumvending.
Stop Loss
- Indstil stoptabet på fraktalen over indgangslyset.
Udgang
- Luk handelen, så snart RSI for MACD-dobbeltstænger ændrer sig til goldenrod, hvilket indikerer en mulig bullish momentumvending.
Konklusion
Denne handelsstrategi kan være en god metode til at handle med trenden, da den giver handlende mulighed for at handle på tilbagetrækninger. Der er dog tilfælde, hvor farveændringen af søjlerne stadig kan være lidt forsinket, hvilket er almindeligt for mange indikatorer. Handlende kan justere variablerne i indikatorindstillingerne for at gøre indikatoren mere lydhør over for prisbevægelser og mindske forsinkelsen yderligere.
Anbefalede MT5-mæglere
XM Broker
- Gratis $ 50 For at begynde at handle med det samme! (Tilbagetrækbar fortjeneste)
- Indbetalingsbonus op til $5,000
- Ubegrænset loyalitetsprogram
- Prisvindende Forex Broker
- Yderligere eksklusive bonusser Gennem året

>> Tilmeld dig XM Broker-konto her <
FBS mægler
- Handel 100 bonus: Gratis $100 for at kickstarte din handelsrejse!
- 100% indbetalingsbonus: Fordoble dit indskud op til $10,000, og handel med øget kapital.
- Udnyttelse op til 1: 3000: Maksimering af potentielle overskud med en af de højeste gearingsmuligheder, der findes.
- Prisen 'Bedste kundeservicemægler Asia': Anerkendt ekspertise inden for kundesupport og service.
- Sæsonbestemte kampagner: Nyd en række eksklusive bonusser og kampagnetilbud hele året rundt.

>> Tilmeld dig FBS Broker-konto her <
Klik her nedenfor for at downloade: