


Der er mange måder at handle markedet på. Nogle handlende bruger ren prishandling med nøgne diagrammer. Andre bruger en række tekniske indikatorer. Mange bruger trendfølgende strategier, mens nogle handelsområdebundne strategier. Andre handler med momentumstrategier, mens andre handler betyder vendinger. Alle disse typer strategier kunne fungere, hvis de bruges af den rigtige erhvervsdrivende. Som de siger, er der mange måder at flå en kat på.
Selvom disse handelsstrategier har tydelige forskelle, er der også mange handelsopsætninger og scenarier, hvor disse forskellige strategier kan overlappe hinanden. Handlende med forskellige handelsstrategier ville have forskellige årsager og forskellige strategier bag en handel, men de kunne stadig handle med det samme valutapar ved det samme indgangspunkt.
Handel handler om sandsynligheder. En af de bedste måder at forbedre dine handelssandsynligheder på er ved at lede efter sammenløb. Selvom det er helt fint at handle sammenløb baseret på individuelle regler eller indikatorer, er det også muligt at bekræfte et handelssetup med varierende strategiske årsager.
Rockstar Bollinger Bands Forex Trading Strategy er en strategi, der kombinerer både trendvendinger og momentumhandelsstrategier. Den identificerer mulige trendvendinger ved hjælp af konceptet med en crossover-strategi. Det bekræfter også momentum ved at observere for momentum stearinlys, der signalerer begyndelsen på en ekspansionsfase lige efter en markedssammentrækningsfase.
MUV indikator
MUV-indikatoren er en tilpasset teknisk indikator baseret på glidende gennemsnit. Det er et modificeret glidende gennemsnit, som plotter en glidende gennemsnitslinje, som karakteristisk er meget lydhør over for prishandling, samtidig med at den udjævnes for at undgå uønskede falske signaler.
MUV-indikatorlinjen kan bruges ligesom et almindeligt glidende gennemsnit. Den kan bruges til at identificere trendbias baseret på prisens placering i forhold til MUV-linjen eller baseret på linjens hældning. Den kan også bruges til at identificere trendvendinger ved at parre den med en anden glidende gennemsnitslinje og bruge den som en crossover-signalindikator.
Bollinger Bands
Bollinger Bands er en meget brugt teknisk indikator, som er en del af kanal- eller båndtypen af indikatoren.
Bollinger Bands-indikatoren plotter tre linjer. Den midterste linje er en SMA-linje (Simple Moving Average). De to yderste linjer er standardafvigelser fra den midterste linje normalt sat til +/-2 standardafvigelser.
De tre ovennævnte linjer danner en kanal- eller båndtypestruktur, som omslutter prishandling. Disse tre linjer fungerer som dynamiske støtte- og modstandslinjer, hvor prisen enten kan hoppe fra eller bryde ud af.
Trendfølgende handlende bruger hældningen på midterlinjen til at identificere trendretningen. Gennemsnitlige reverseringshandlere bruger de ydre bånd som grundlag for overkøbte og oversolgte markedsforhold og handelsafvisninger fra disse niveauer. Momentum-handlere identificerer momentum-lys, der knækker uden for båndene, som et momentum-handelsopsætning. Båndene kan også bruges til at identificere volatilitet baseret på sammentrækning og udvidelse af de ydre bånd.
Rads MACD
Rads MACD er en brugerdefineret teknisk indikator baseret på den klassiske Moving Average Convergence and Divergence (MACD) indikator.
Den traditionelle MACD er en oscillatortype indikator, som beregner forskellen mellem to glidende gennemsnitslinjer. Forskellen plottes derefter på et separat vindue. Derefter plottes en signallinje, som er afledt fra MACD-linjen, efter MACD-linjen. Denne linje er et glidende gennemsnit af den tidligere MACD-linje.
Krydsninger mellem de to linjer indikerer en mulig trendvending. Linjerne kan også bruges til at identificere oversolgte eller overkøbte forhold baseret på dens afstand fra midterlinjen, som er nul, sammenlignet med tidligere svingpunkter.
Rads MACD er en modificeret version af MACD. Det gør brug af modificerede glidende gennemsnit til at beregne de underliggende MACD og signallinjer. I stedet for at plotte de to linjer, plotter den i stedet forskellen mellem de to linjer, hvilket gør det nemmere for handlende at identificere mulige trendvendende signaler. Farven på søjlerne indikerer også styrkelsen og svækkelsen af trenden. Positive lime-stænger indikerer en styrkende bullish trend, mens positive røde søjler indikerer en svækkende bullish trend. Negative røde søjler indikerer en styrkende bearish trend, mens negative lime søjler indikerer en aftagende bearish trend.
Trading Strategi
Denne strategi er en kombination af en crossover-trendvendingsstrategi og en momentum-handelsstrategi.
Crossover-handelsopsætningen identificeres baseret på krydsningen af MUV-linjen og midtlinjen af Bollinger Bands, som også er en Simple Moving Average-linje. Dette vil signalere en sandsynlig trendvending, som burde advare os om en sandsynlig handelsopsætning.
Rads MACD-indikatoren bør også bekræfte trendvendingen baseret på skift af histogramstængerne. Farven på stængerne skulle også indikere en styrkende frisk trend.
Momentum-signalet er baseret på et momentum-lys, der lukker kraftigt uden for Bollinger-båndene. Disse momentumsignaler skulle også komme efter en forudgående markedskontraktionsfase, som også kunne identificeres baseret på sammentrækningen og udvidelsen af Bollinger Bands.
Indikatorer:
- MuV
- Bollinger Bands
- Periode: 36
- Rads_MACD
Foretrukne tidsrammer: 1-timers, 4-timers og daglige diagrammer
Valuta Par: FX majors, mindreårige og krydsninger
Handelssessioner: Tokyo, London og New York sessioner
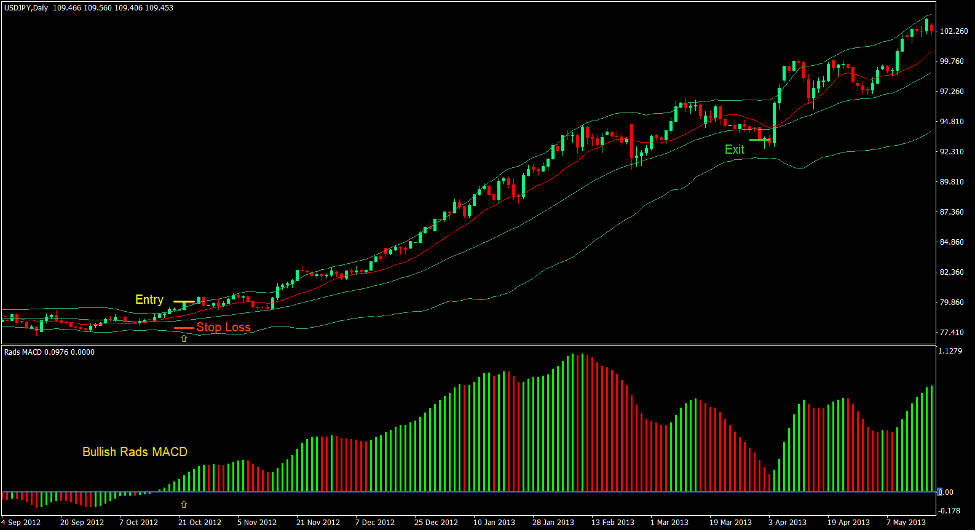
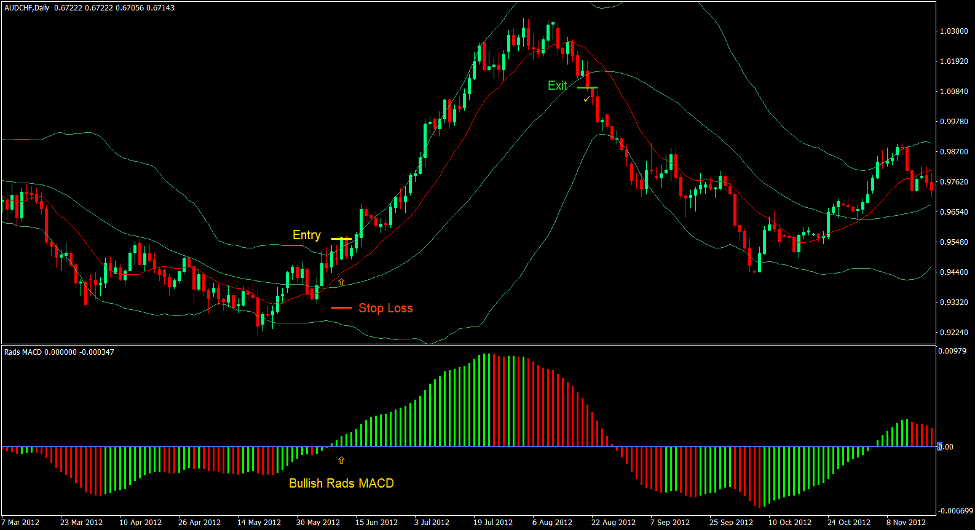
Køb Trade Setup
Indgang
- MUV-linjen skal krydse over midtlinjen af Bollinger Bands.
- Rads MACD-histogramstængerne skal krydse over nul og skal være kalk.
- Et bullish momentum-lys bør lukke over de øvre Bollinger-bånd.
- Indtast en købsordre på bekræftelsen af disse betingelser.
Stop Loss
- Indstil stop loss på støtten under indgangslyset.
Udgang
- Luk handlen, så snart prisen lukker under Bollinger Bands' midtlinje.
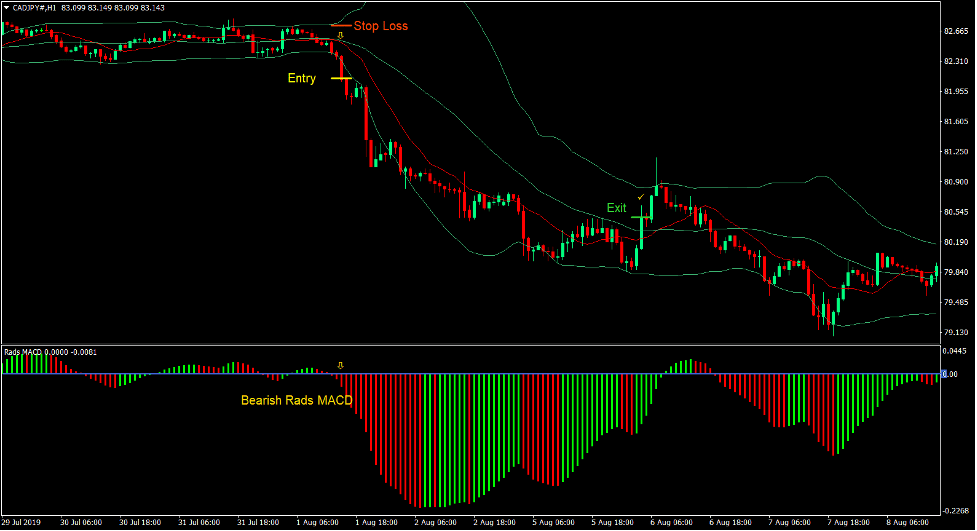
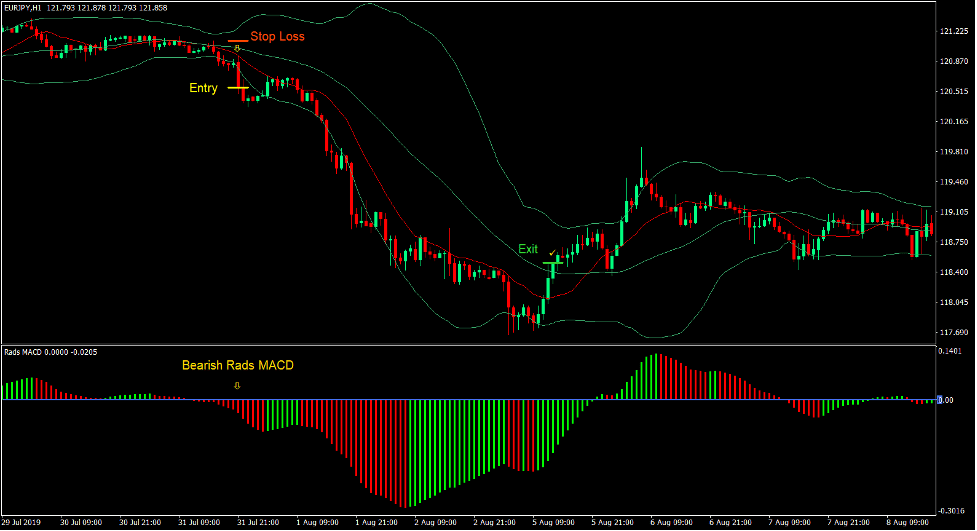
Sælg handelsopsætning
Indgang
- MUV-linjen skal krydse under midtlinjen af Bollinger Bands.
- Rads MACD-histogramstængerne skal krydse under nul og skal være røde.
- Et bearish momentum-lys bør lukke under de nederste Bollinger-bånd.
- Indtast en salgsordre ved bekræftelsen af disse betingelser.
Stop Loss
- Indstil stoptabet på modstanden over indgangslyset.
Udgang
- Luk handelen, så snart prisen lukker over Bollinger Bands' midtlinje.
Konklusion
Denne handelsstrategi er en fungerende handelsstrategi. Mange handlende bruger krydsningen af to glidende gennemsnitslinjer til at identificere en trendvending. Mange handlende bruger også lukningen af et momentum-lys uden for Bollinger-båndene til at identificere et momentum-handelsopsætning. Kombination af disse to sammen giver mulighed for en handelsopsætning, som er baseret både på en crossover og en momentumhandelsopsætning. Resultatet er en handelsopsætning med en forbedret gevinstsandsynlighed.
Anbefalede MT4-mæglere
XM Broker
- Gratis $ 50 For at begynde at handle med det samme! (Tilbagetrækbar fortjeneste)
- Indbetalingsbonus op til $5,000
- Ubegrænset loyalitetsprogram
- Prisvindende Forex Broker
- Yderligere eksklusive bonusser Gennem året

>> Tilmeld dig XM Broker-konto her <
FBS mægler
- Handel 100 bonus: Gratis $100 for at kickstarte din handelsrejse!
- 100% indbetalingsbonus: Fordoble dit indskud op til $10,000, og handel med øget kapital.
- Udnyttelse op til 1: 3000: Maksimering af potentielle overskud med en af de højeste gearingsmuligheder, der findes.
- Prisen 'Bedste kundeservicemægler Asia': Anerkendt ekspertise inden for kundesupport og service.
- Sæsonbestemte kampagner: Nyd en række eksklusive bonusser og kampagnetilbud hele året rundt.

>> Tilmeld dig FBS Broker-konto her <
Klik her nedenfor for at downloade: