


Price Action, et af de mest udbredte udtryk i handel, men alligevel har forskellige forhandlere forskellige beskrivelser af det. Nogle antyder, at det er en analyse af de grundlæggende prisbevægelser, der genererer ind- og udgangssignaler, og at det skiller sig ud ved ikke at kræve brug af indikatorer. Nogle handlende identificerer det som bevægelserne af et værdipapirs pris plottet over tid. Disse beskrivelser kan være klare for nogle handlende, men de kan også være meget vage for nogle.
Personligt vil jeg beskrive prishandling som karakteristika ved prisbevægelser plottet på et prisdiagram, som kan hjælpe med at indikere trendretning, momentum, reverseringer, fortsættelser og mange andre markedsscenarier, der kan forekomme. Dette kan være vagt, men hvis du vil undersøge hver enkelt af disse betingelser, vil du se prishandlingsegenskaber, der kan hjælpe os med at identificere hver enkelt. For eksempel kan optrends identificeres baseret på stigende svinghøjde og svinglave, mens nedtrends kan identificeres ved et konstant fald i svingpunkterne. Momentum kan identificeres baseret på fyldige lange stearinlys, der skubber i én retning. Tilbageførsler kan identificeres baseret på prisafvisningsegenskaber såsom væger, der presser mod et prisniveau. Fortsættelser kan identificeres ved et pludseligt skub i retning af trenden lige efter en retracement eller sammentrækning.
Her vil vi se på et trendfortsættelsesscenarie, hvor poster identificeres baseret på prisafvisninger. Rene prishandlingshandlere kan også hævde, at prishandling kræver brug af nøgne diagrammer. Der er dog ingen regel, der forhindrer os i at bruge nogle få tekniske indikatorer til at hjælpe os med at identificere en god handelsopsætning.
HAMA
HAMA, Heiken Ashi Moving Average eller Heiken Ashi Smoothed, de kan bruges i flæng. HAMA er en trendfølgende teknisk indikator, som udmærker sig ved at hjælpe handlende med tydeligt at identificere trendretningen. Det er karakteristisk meget lydhørt over for prisbevægelser, samtidig med at det ikke er for omskifteligt til nemt at producere falske signaler.
HAMA er en udløber eller afledt af Heiken Ashi lysestagerne og en grundlæggende eksponentielt bevægende gennemsnit (EMA) linje. Det producerer søjler, der skifter farve for at angive retningen af trenden, samtidig med at det plotter disse søjler med samme reaktionsevne som EMA-linjen.
Heiken Ashi på japansk betyder bogstaveligt talt gennemsnitlige barer. I en vis forstand er det, hvad HAMA gør. Det gennemsnit af historiske prisdata. Den resulterende beregning plottes derefter som søjler overlejret på prisdiagrammet. Farven på søjlerne skifter afhængigt af trendens retning. Blå søjler indikerer en bullish trend, mens røde søjler indikerer en bearish trend. Som følge heraf kunne farveændringer indikere en potentiel trendvending.
RAVI
RAVI står grundlæggende for Range Action Verification Index. Denne indikator repræsenterer den relative konvergens eller divergens af et underliggende glidende gennemsnit af et omsætteligt instrument, øget hundrede gange. Den baserede RAVI-konfiguration er baseret på en underliggende 13-periods Simple Moving Average (SMA). Det var oprindeligt baseret på en 13-ugers periode, hvilket svarer til en 3-måneders periode. Men i betragtning af teknologien og hastigheden af handel i dag, kan den også anvendes på de lavere tidsrammer.
RAVI-indikatoren er en teknisk indikator af oscillatortype. Den plotter søjler, der svinger omkring dens midterlinje, nul. Positive søjler indikerer en bullish trendbias, mens negative søjler indikerer en bearish trendbias.
Styrkelsen af et trendmomentum kan også identificeres ud fra bjælkernes farve. Grønne søjler indikerer en styrkende bullish trend, mens røde søjler indikerer en styrkende bearish trend. Grå søjler på den anden side indikerer et neutralt momentum, uanset om det er bullish eller bearish.
Handlende kan bruge denne indikator som et trendskiftende indgangssignal baseret på skift af søjlerne. Det kan også bruges som et trendretningsfilter for at hjælpe handlende med at undgå at handle mod trenden.
Trading Strategi
RAVI HAMA Push Forex Trading Strategy handler med retningen af en eksisterende trend ved at bruge prisafvisning som hovedindgangssignalet.
Først identificeres trendretning baseret på farven på HAMA-stængerne. En sådan trendretning bekræftes derefter baseret på det stigende eller faldende svingpunktmønster for prishandling. RAVI søjlerne skal også bekræfte trendretningen baseret på om søjlerne generelt er positive eller negative. Handler tages udelukkende i retning af trenden.
Så snart vi isolerer trenden og handelsretningen, venter vi på, at prisen vender tilbage mod området med HAMA-barerne. Prishandling bør vise tegn på prisafvisning, når den nærmer sig eller rører ved HAMA-stængerne. Dette er baseret på væger, der skubber mod HAMA-stængerne. Dette ville være vores indgangssignal.
Indikatorer:
- HAMA_
- Ravisignal
Foretrukne tidsrammer: 30-minutters, 1-timers, 4-timers og daglige diagrammer
Valuta Par: FX majors, mindreårige og krydsninger
Handelssessioner: Tokyo, London og New York sessioner
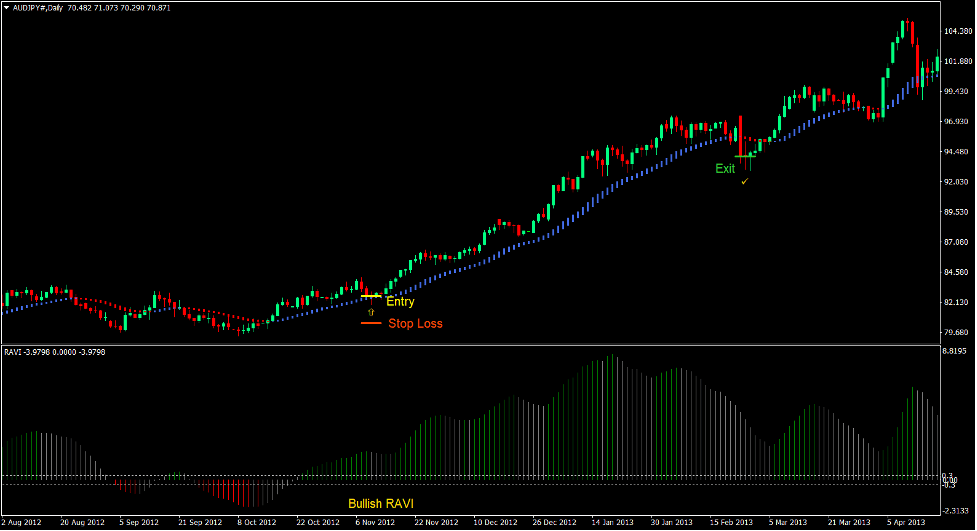
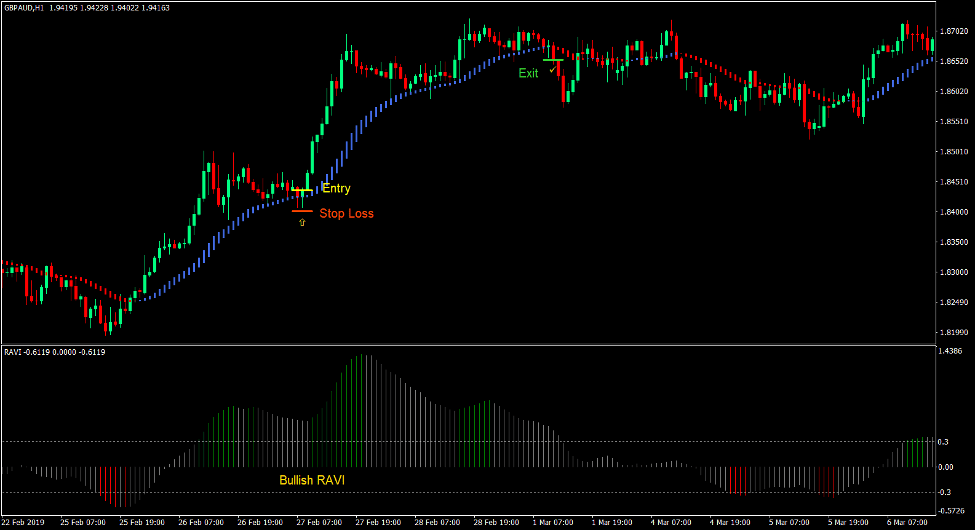
Køb Trade Setup
Indgang
- HAMA-stængerne skal være blå.
- Gyngehøjderne og swinglavene burde være stigende.
- RAVI-bjælkerne skal være positive.
- Prisen bør gå tilbage mod HAMA-barerne.
- Prisen bør afvise HAMA-barernes prisniveau angivet af væger, der skubber imod den.
- Indtast en købsordre på bekræftelsen af betingelserne ovenfor.
Stop Loss
- Indstil stop loss på støtten under indgangslyset.
- Indstil stop loss under HAMA-stængerne.
Udgang
- Luk handlen, så snart HAMA-stængerne skifter til røde.
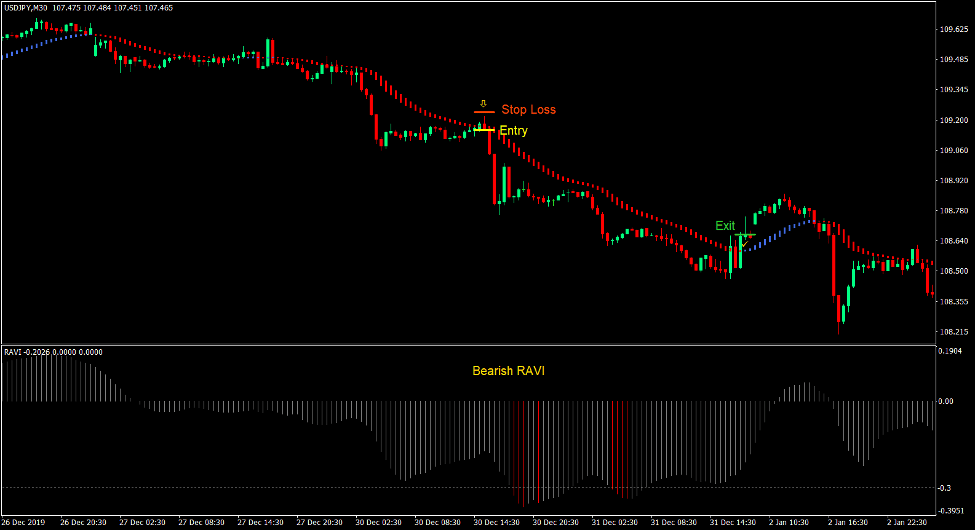
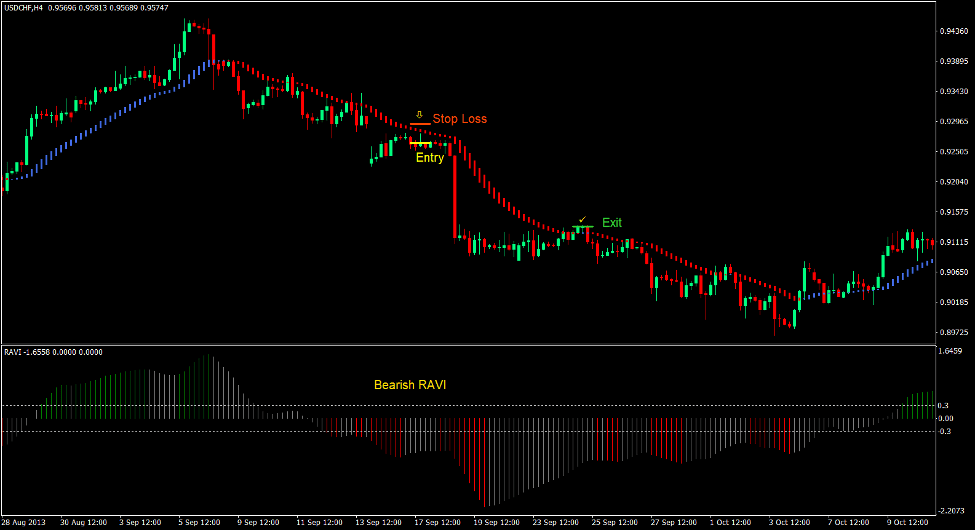
Sælg handelsopsætning
Indgang
- HAMA-bjælkerne skal være røde.
- Gyngehøjderne og swing-lavene bør falde.
- RAVI-bjælkerne skal være negative.
- Prisen bør gå tilbage mod HAMA-barerne.
- Prisen bør afvise HAMA-barernes prisniveau angivet af væger, der skubber imod den.
- Indtast en salgsordre på bekræftelsen af betingelserne ovenfor.
Stop Loss
- Indstil stoptabet på modstanden over indgangslyset.
- Indstil stop losset over HAMA-stængerne.
Udgang
- Luk handlen, så snart HAMA-stængerne skifter til blå.
Konklusion
Denne handelsstrategi er en grundlæggende trendfølgende og trendfortsættelsesstrategi, som inkorporerer prisafvisning for at identificere specifikke indgangspunkter. Dette giver os som handlende mulighed for at komme ind til en bedre pris i stedet for at være for sent til at gå ind i en trend.
Denne strategi kan give ensartet overskud, når den bruges i den rigtige trendende markedstilstand.
Anbefalede MT4-mæglere
XM Broker
- Gratis $ 50 For at begynde at handle med det samme! (Tilbagetrækbar fortjeneste)
- Indbetalingsbonus op til $5,000
- Ubegrænset loyalitetsprogram
- Prisvindende Forex Broker
- Yderligere eksklusive bonusser Gennem året

>> Tilmeld dig XM Broker-konto her <
FBS mægler
- Handel 100 bonus: Gratis $100 for at kickstarte din handelsrejse!
- 100% indbetalingsbonus: Fordoble dit indskud op til $10,000, og handel med øget kapital.
- Udnyttelse op til 1: 3000: Maksimering af potentielle overskud med en af de højeste gearingsmuligheder, der findes.
- Prisen 'Bedste kundeservicemægler Asia': Anerkendt ekspertise inden for kundesupport og service.
- Sæsonbestemte kampagner: Nyd en række eksklusive bonusser og kampagnetilbud hele året rundt.

>> Tilmeld dig FBS Broker-konto her <
Klik her nedenfor for at downloade: