


"Handle med trenden!" Dette er et banalt ordsprog, som mange forhandlere bruger. Det er dog sandsynligvis, fordi dette udsagn rummer en masse sandhed i sig. Dette skyldes, at handel i trendens retning har større sandsynlighed for, at prisen før eller siden vil bevæge sig i den ønskede retning. Dette oversættes til en højere sandsynlighed for en vindende handel, hvis handlen administreres eller indtastes korrekt.
At handle med trenden betyder at se på, hvor den generelle strøm af markedet bevæger sig. Bevæger prisen sig generelt højere og højere, eller er den på vej ned? Er markedet i en optrend eller er det i en nedadgående tendens? Så snart en erhvervsdrivende identificerer et trendmarked og trendens retning, bør den erhvervsdrivende kun søge at handle i trendens retning.
Nu er spørgsmålet, hvornår eller hvor skal vi handle? Forskellige handlende har forskellige tilgange. Momentumhandlere ville vente på stærke momentumsignaler, før de ville tage handler. Klog handlende på den anden side ville vente på retracements. Dette skyldes, at retracements er muligheder for handlende til at indgå handler til en bedre pris.
Quantile Swing Forex Trading Strategy er en trendfølgende strategi, som giver handelssignaler baseret på prisafvisninger efter en retracement- eller konsolideringsfase under trendende markedsforhold. Dette giver poster, der har en relativt stor sandsynlighed på grund af trenden, samtidig med at handler generelt indgås til et godt prispunkt.
Kvantilbånd
Quantile Bands-indikator er en tilpasset teknisk indikator, som er baseret på sandsynlighedsvidenskaben. I statistikker er kvantilbånd dybest set skæringspunkter, der deler intervallet af sandsynlighedsfordeling i sammenhængende intervaller med lige sandsynlighed.
Kvantilbåndsindikator plotter linjer, der tjener som skæringspunkter for sandsynlighedsområdet. Disse linjer bevæger sig afhængigt af retningen og styrken af trenden. Hvis tendensen er bullish, vil midterlinjen hælde opad. Hvis tendensen er bearish, vil midterlinjen falde nedad. Hvis prisen vinder bullish styrke, vil den øverste halvdel af Quantile Bands udvide sig. Hvis markedet er ved at vinde bearish momentum, vil den nederste halvdel af Quantile Bands udvide sig.
Kvantilbåndsindikatoren kan bruges til at detektere tendenser. Hvis prishandling generelt forbliver på den øverste halvdel af båndene, så er tendensen bullish. Hvis prishandling generelt er på den nederste halvdel af båndene, så er tendensen bearish. Hvis prishandlingen krydser midtlinjen flere gange, er markedet ikke i trend. Midterlinjen kan også bruges som en dynamisk støtte eller modstand. I en trendende markedstilstand vil prisen have en tendens til at hoppe af midtlinjen.
SwingMan Ultra Super TRIX PV
SwingMan Ultra Super Trix PV (SwingMan) er en brugerdefineret indikator, som er en del af oscillatortypen af indikatorer.
SwingMan-indikatoren plotter histogrambjælker for at angive markedets retningsmæssige skævhed. Disse søjler kan enten være positive eller negative. Positive søjler indikerer en bullish retningsbestemt bias, mens negative søjler indikerer en bearish retningsbestemt skævhed. Stængerne skifter også farve afhængigt af styrken eller momentum af trenden. Grønne søjler indikerer en styrkende bullish bias, mens gule grønne søjler indikerer en svækkende bullish bias. Rødbrune bjælker indikerer en styrkende bearish bias, mens tomatstænger indikerer en svækkelse bearish bias.
Relativ Vigor Index
Relative Vigor Index (RVI) er en teknisk indikator, som også er en oscillatortype indikator.
RVI angiver trendretning eller bias ved at måle styrken af en trend eller prisbevægelse og sammenligne den med historiske prisbevægelser. Dette er baseret på tendensen til prishandling til løbende at skabe lavere svingpunkter i en nedadgående trend og højere svingpunkter i en optrend. Men i modsætning til mange populære oscillatorindikatorer anvender RVI en udjævnende effekt. Dette mindsker effekten af vildfarne og isolerede prisstigninger, som går imod trendens retning, hvilket skaber en mere pålidelig trendbias.
RVI-indikatoren plotter to linjer, som kan svinge til positive eller negative. Positive linjer indikerer en bullish retningsbestemt bias, mens negative linjer indikerer en bearish retningsbias. Momentum identificeres også ud fra, hvordan de to linjer overlapper hinanden. Hvis den hurtigere linje er over den langsommere linje, identificeres bullish momentum. Hvis den hurtigere linje er under den langsommere linje, identificeres bearish momentum.
Trading Strategi
Denne handelsstrategi er en trendfølgende strategi, som kombinerer trendbias-indikationer, der kommer fra de ovennævnte tekniske indikatorer samt handelsopsætninger baseret på prishandling.
På kvantilbåndsindikatoren identificeres trendretning baseret på hældningen af midterlinjen, såvel som den generelle placering af prishandling i forhold til sektionerne af kvantilbåndene.
På SwingMan-indikatoren og RVI-indikatoren er trendretning baseret på, om histogramstængerne eller -linjerne generelt forbliver over nul eller under nul.
Så snart tendensen er opdaget, venter vi på, at prisen går tilbage mod midtlinjen af Quantile Bands. Derefter venter vi på prishandling for at indikere prisafvisning på området af midterlinjen. Hvis prisen afviser midtlinjen af kvantilbåndene, og den retningsbestemte bias angivet af de tekniske indikatorer forbliver intakt, genereres en gyldig handelsopsætning.
Indikatorer:
- Kvantilbånd_1.3
- Beregningsperiode: 40
- SwingMan-UltraSuperTRIX_PV_4col
- TRIX-periode: 12
- Relativ Vigor Index
- Periode: 32
Foretrukne tidsrammer: 1-timers, 4-timers og daglige diagrammer
Valuta Par: FX majors, mindreårige og krydsninger
Handelssessioner: Tokyo, London og New York sessioner
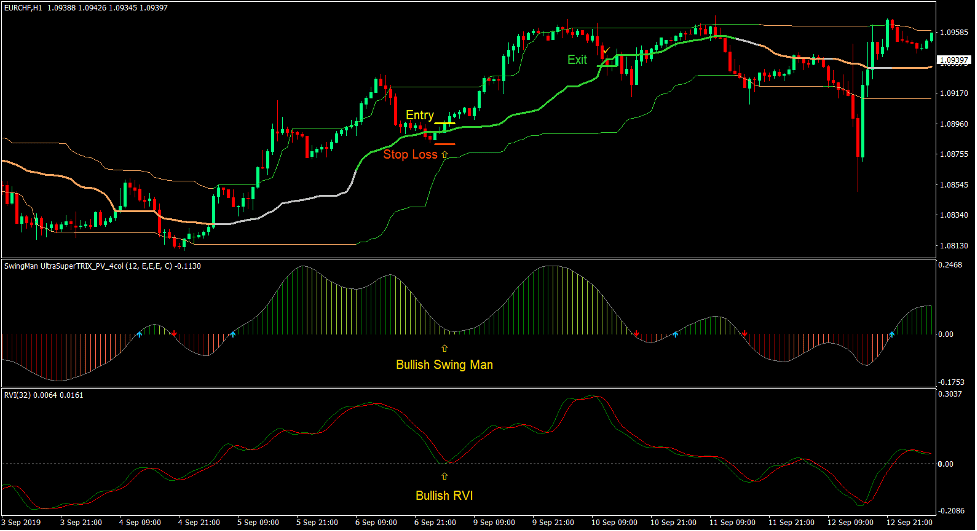
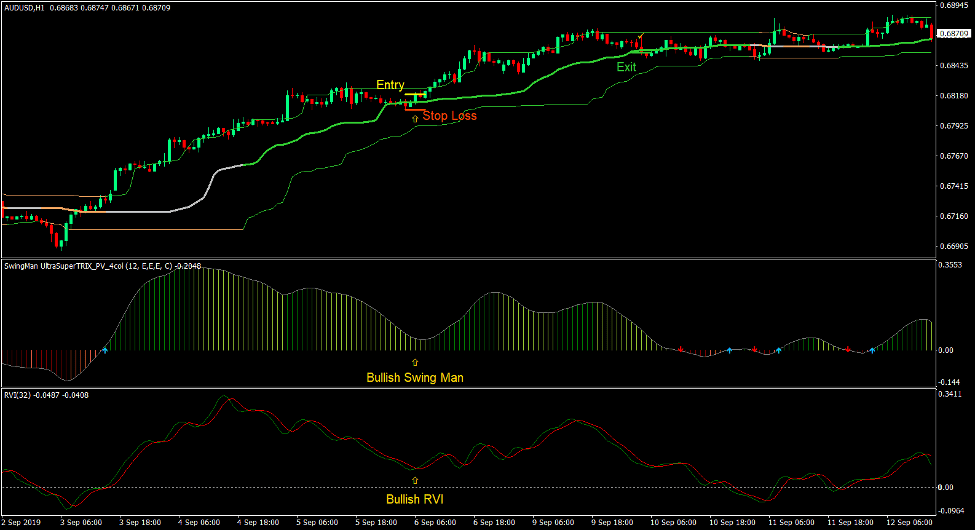
Køb Trade Setup
Indgang
- Prishandling bør generelt være på den øverste halvdel af kvantilbåndene.
- SwingMan-bjælkerne skal generelt være positive.
- RVI-linjerne bør generelt være positive.
- Prisen skal gå tilbage mod midtlinjen af Quantile Bands.
- Prishandling bør vise tegn på prisafvisning på området af midtlinjen af kvantilbåndene.
- RVI-linjerne skulle begynde at tilslutte sig.
- Indtast en købsordre på bekræftelsen af betingelserne ovenfor.
Stop Loss
- Indstil stop loss på støtteniveauet under indgangslyset.
Udgang
- Luk handlen, så snart prisen lukker under midterlinjen af Quantile Bands.
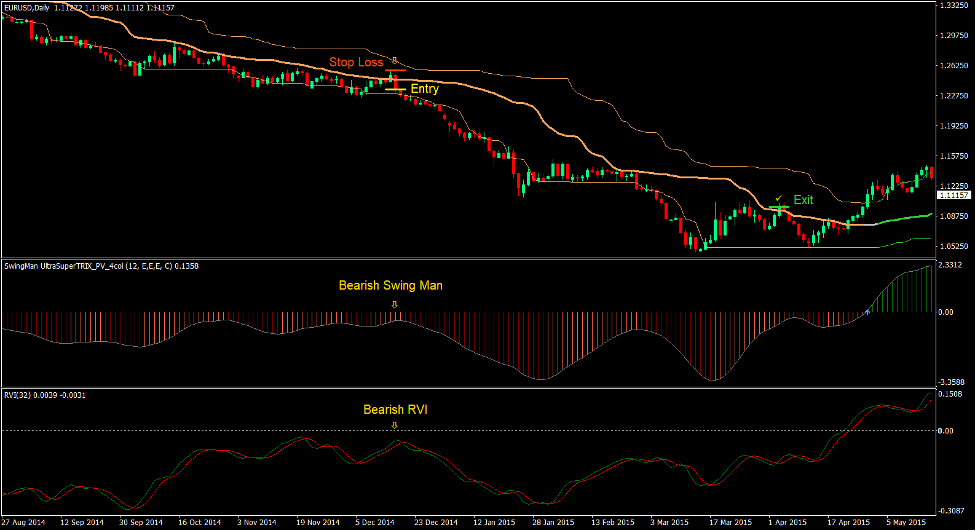
Sælg handelsopsætning
Indgang
- Prishandling bør generelt være på den nederste halvdel af kvantilbåndene.
- SwingMan-bjælkerne skal generelt være negative.
- RVI-linjerne bør generelt være negative.
- Prisen skal gå tilbage mod midtlinjen af Quantile Bands.
- Prishandling bør vise tegn på prisafvisning på området af midtlinjen af kvantilbåndene.
- RVI-linjerne skulle begynde at hænge fast.
- Indtast en salgsordre på bekræftelsen af betingelserne ovenfor.
Stop Loss
- Indstil stoptabet på modstandsniveauet over indgangslyset.
Udgang
- Luk handlen, så snart prisen lukker over midterlinjen af kvantilbåndene.

Konklusion
Denne handelsstrategi giver handlende mulighed for objektivt at identificere trendende markedsforhold baseret på et sammenløb af tekniske indikatorer. Det er dog også bedst, hvis handlende visuelt kunne bekræfte, om markedet faktisk er trending.
Bortset fra dette bør handlende også lære at visuelt identificere prishandlinger og prisafvisninger baseret på lysestagemønstre. Prisafvisninger og vendingsmønstre, der forekommer på midtlinjen af kvantilbåndene, har en tendens til at fungere effektivt. Dette skyldes, at disse niveauer er gennemsnit af prishandling.
Handlende, der kunne mestre at identificere trendende markeder og prishandling, kunne effektivt bruge denne strategi til at drage fordel af markedet.
Anbefalede MT4-mæglere
XM Broker
- Gratis $ 50 For at begynde at handle med det samme! (Tilbagetrækbar fortjeneste)
- Indbetalingsbonus op til $5,000
- Ubegrænset loyalitetsprogram
- Prisvindende Forex Broker
- Yderligere eksklusive bonusser Gennem året

>> Tilmeld dig XM Broker-konto her <
FBS mægler
- Handel 100 bonus: Gratis $100 for at kickstarte din handelsrejse!
- 100% indbetalingsbonus: Fordoble dit indskud op til $10,000, og handel med øget kapital.
- Udnyttelse op til 1: 3000: Maksimering af potentielle overskud med en af de højeste gearingsmuligheder, der findes.
- Prisen 'Bedste kundeservicemægler Asia': Anerkendt ekspertise inden for kundesupport og service.
- Sæsonbestemte kampagner: Nyd en række eksklusive bonusser og kampagnetilbud hele året rundt.

>> Tilmeld dig FBS Broker-konto her <
Klik her nedenfor for at downloade: