


Momentum-vendinger er fremragende handelsmuligheder. Det er dog ofte vanskeligt at forudse markedsvendinger, da dette ville betyde, at man går imod den nuværende strøm af markedsmomentum. En måde handlende forudser sandsynlige markedsvendinger på er ved at se efter afvigelser.
Handelsstrategien, der skal diskuteres nedenfor, viser os en forenklet metode til at identificere divergenser ved hjælp af OsMA-indikatoren og Zigzag Int-indikatoren.
Glidende gennemsnit af oscillatorindikator
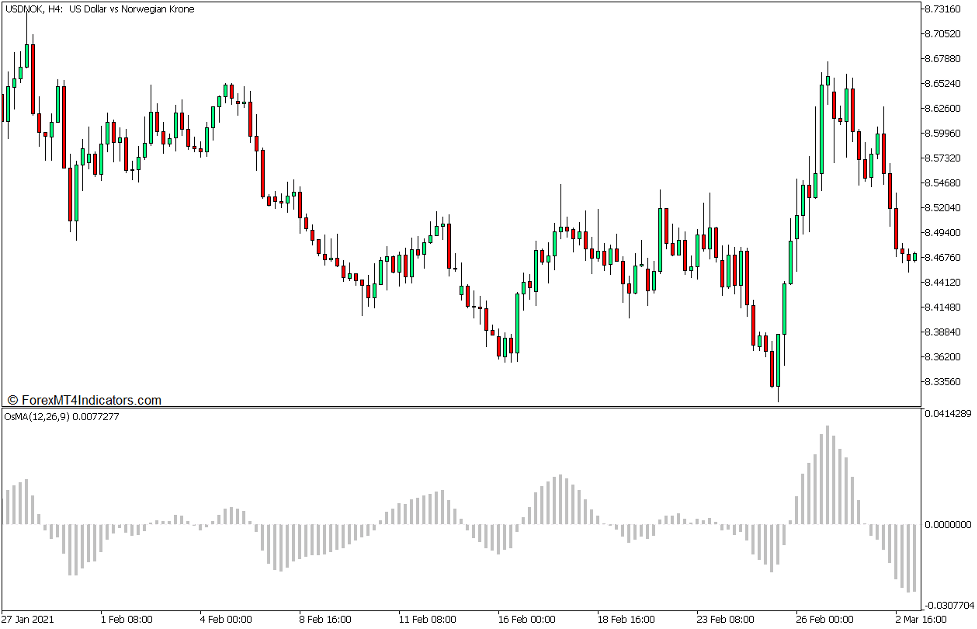
The Moving Average of Oscillator Indicator eller Oscillator of Moving Averages (OsMA) er en momentumindikator, som er afledt af en underliggende oscillator. Som navnet antyder, beregner den for Moving Average (MA) af dens underliggende oscillatorindikator.
Den mest almindelige oscillator, der bruges i OsMA, er Moving Average Convergence and Divergence (MACD). Men andre versioner af OsMA har også brugt forskellige typer oscillatorer i sit program for at komme med en OsMA-indikator, der kunne fungere på forskellige markeder.
Konceptet bag OsMA-indikatoren er ret simpelt. Det er dybest set programmeret til at beregne det glidende gennemsnit af dens underliggende oscillator. Derefter trækker den værdien af det glidende gennemsnit fra oscillatoren. Den resulterende forskel bruges derefter til at plotte OsMA's histogramstænger eller oscillatorlinje.
OsMA-indikatoren, der bruges i denne strategi, er baseret på MACD. Den beregner for de to eksponentielle bevægelige gennemsnit (EMA), hvis forskel bruges som værdien for dens underliggende MACD. Derefter beregner den yderligere for det simple bevægelige gennemsnit (SMA) af værdien, som er afledt af MACD. Til sidst beregner OsMA-indikatoren forskellen mellem MACD-værdien og SMA-værdien. Den resulterende værdi bruges derefter til at plotte histogramstængerne for OsMA-indikatoren.
Denne OsMA-indikator plotter histogrambjælker for at præsentere markedets svingninger. Disse søjler svinger omkring nul. Positive søjler indikerer, at markedet er i en bullish bias, mens negative søjler indikerer, at markedet er i en bearish bias.
Momentumsvingninger kan også forventes baseret på stigende eller faldende OsMA-værdi. En række stigende OsMA-værdier, uanset om de er positive eller negative, indikerer, at markedet er ved at få et bullish momentum. Omvendt indikerer faldende OsMA-værdier et muligt bearish momentumsving.
Zigzag Int Indikator
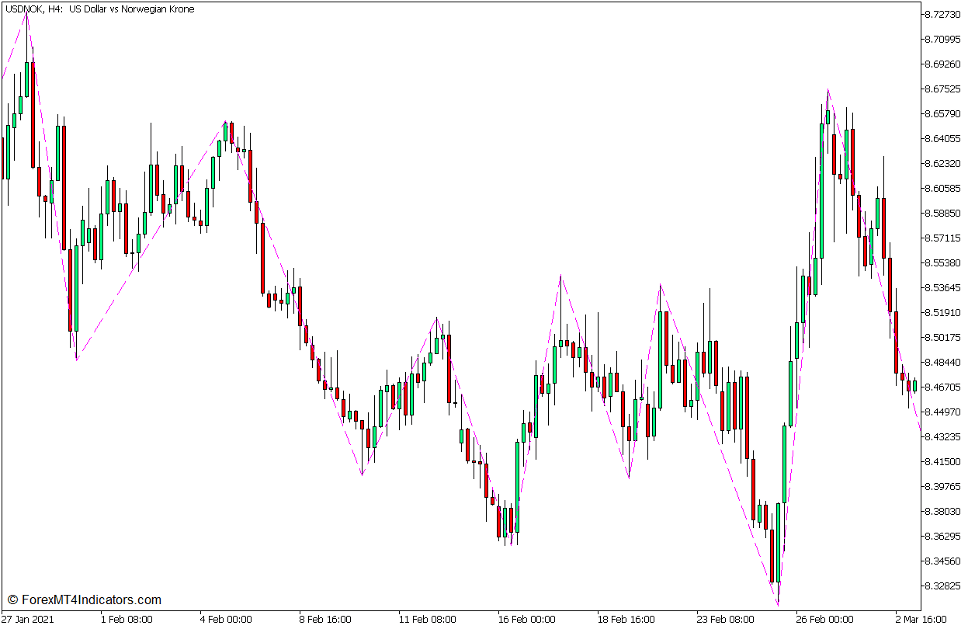
Zigzag Int Indicator er en brugerdefineret teknisk indikator, som er en version af Zigzag Indicator. Det er en indikator, der blev udviklet til at hjælpe handlende med at identificere svinghøjder og svingnedgange ved at plotte linjer, der forbinder et svingpunkt med et andet.
Denne indikator bruger en algoritme, der identificerer svinghøjder og svingnedgange ved at beregne afvigelsen af prisbevægelser fra den foregående momentumretning. Den har en afvigelsestærskel, som vil udløse indikatoren til at detektere en ny momentumsvingretning, når den overskrides. Denne afvigelsestærskel er normalt forudindstillet til 5 %. Hvis prishandlingen bevæger sig mod den aktuelle momentumretning over denne tærskel, vil indikatoren opdage en ny momentumretning og forsøge at opdage det nye svingpunkt. Så snart den detekterer det nye svingpunkt, vil den plotte en linje, der forbinder det forrige svingpunkt med det nye svingpunkt. Indikatoren ville gentage den samme proces kontinuerligt og plotte linjer, der bevæger sig op, når der detekteres et sving højt, og linjer, der bevæger sig ned, når der detekteres et sving lavt, hvilket skaber et zigzag-mønster, og dermed navnet Zigzag Indicator.
Denne version af Zigzag Indicator plotter en blå stiplet linje, der forbinder svinghøjderne og svingnederne. Handlende kan bruge de identificerede svingpunkter til nemt at forstå kursen for prishandling, støtte- og modstandsniveauer og ordreblokke.
Handelsstrategikoncept
OsMA og Zigzag INT Divergens Forex Trading Strategy for MT5 er en reversal trading strategi, som handler afvigelser ved hjælp af Zigzag Int Indicator og OsMA Indicator.
Zigzag Int-indikatoren bruges til at hjælpe handlende med nemt at identificere gyldige svinghøjder og svingnedture. De identificerede svinghøjder og svingnedgange sammenlignes derefter med de tilsvarende toppe og dyk på OsMA-diagrammet. Derfra kunne vi begynde at observere, om prishandlinger danner en divergens sammenlignet med OsMA-stængerne.
Hvis der er en gyldig divergens, kunne vi så observere lysestagernes egenskaber, hvis den afviser niveauet og begynder at vende. Dette kan identificeres gennem lysestagemønstre, lysfarveændring og svækkelse af momentum. Vendningen bekræftes af ændringen af OsMA-stængernes bane, enten fra stigende til faldende værdier eller omvendt.
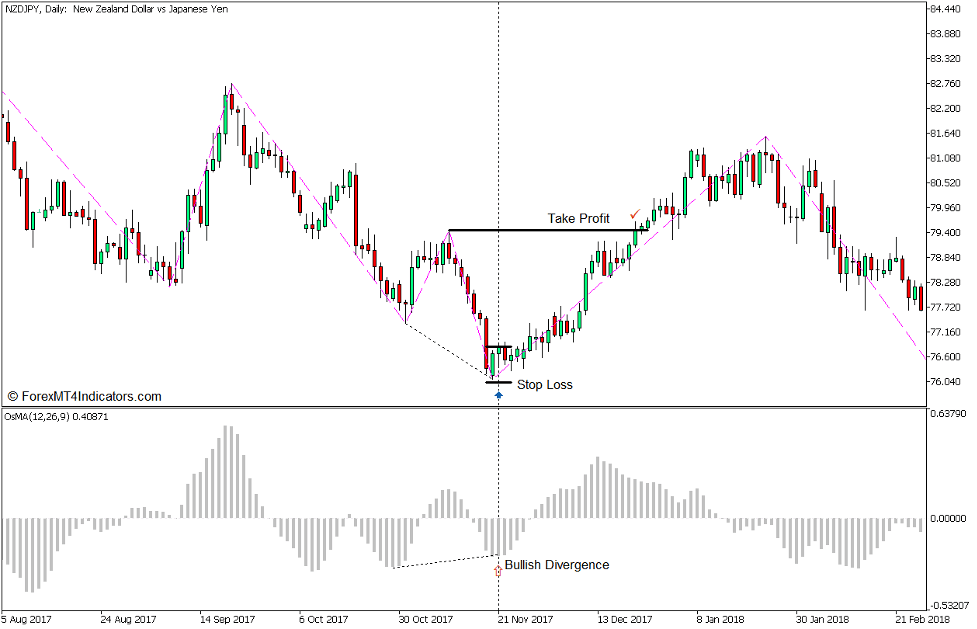
Køb Trade Setup
Indgang
- Identificer de gyldige lave svingninger som angivet af Zigzag Int-indikatoren.
- Sammenlign swing-lows med faldene i OsMA-stængerne, og bemærk, om der er gyldig bullish divergens.
- Observer prishandling, hvis det indikerer en sandsynlig bullish vending.
- Åbn en købsordre, så snart OsMA-barværdierne begynder at stige.
Stop Loss
- Indstil stop loss på fraktalen under indgangslyset.
Udgang
- Indstil målet for take-profit på det seneste swing high.
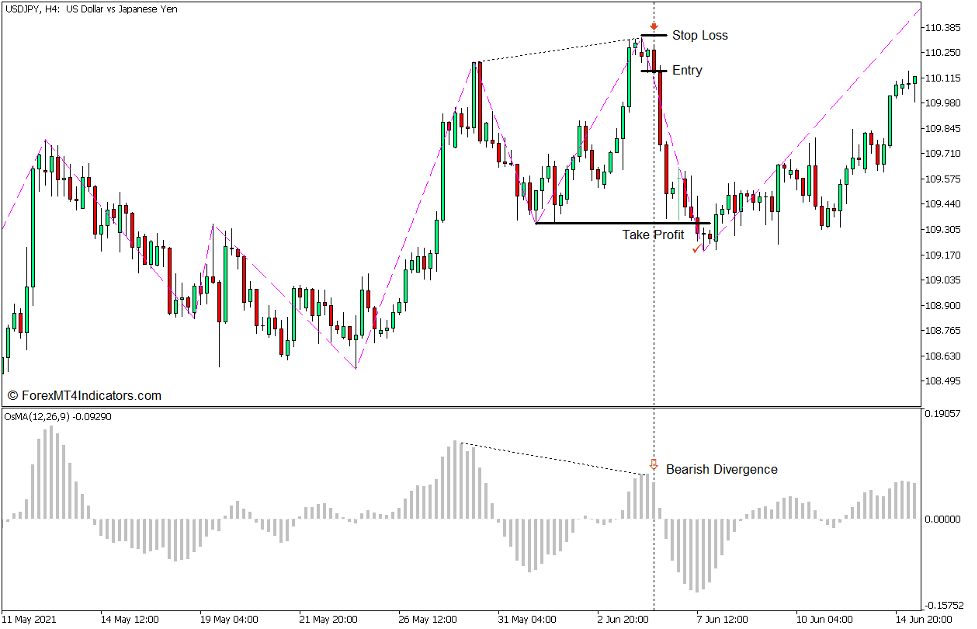
Sælg handelsopsætning
Indgang
- Identificer de gyldige svinghøjder som angivet af Zigzag Int-indikatoren.
- Sammenlign svinghøjderne med toppen af OsMA-stængerne, og bemærk, om der er gyldig bearish divergens.
- Observer prishandling, hvis det indikerer en sandsynlig bearish vending.
- Åbn en salgsordre, så snart OsMA-bjælkeværdierne begynder at falde.
Stop Loss
- Indstil stoptabet på fraktalen over indgangslyset.
Udgang
- Indstil målet for take-profit på det seneste lavt sving.
Konklusion
Afvigelser kan være meget effektive indikationer på en sandsynlig vending. Faktisk er der mange professionelle forhandlere, der bruger divergenser som deres primære grundlag for at overveje en sandsynlig markedsvending.
Handel baseret på divergenser kræver dog også, at handlende er dygtige til at identificere swing-høje og swing-lave. Denne handelsstrategi viser os simpelthen en forenklet metode til, hvordan man objektivt identificerer svinghøjder og svingnedgange ved hjælp af Zigzag Int-indikatoren, hvilket giver os mulighed for at bruge svingpunkterne som grundlag for at identificere potentielle divergenser.
Anbefalede MT5-mæglere
XM Broker
- Gratis $ 50 For at begynde at handle med det samme! (Tilbagetrækbar fortjeneste)
- Indbetalingsbonus op til $5,000
- Ubegrænset loyalitetsprogram
- Prisvindende Forex Broker
- Yderligere eksklusive bonusser Gennem året

>> Tilmeld dig XM Broker-konto her <
FBS mægler
- Handel 100 bonus: Gratis $100 for at kickstarte din handelsrejse!
- 100% indbetalingsbonus: Fordoble dit indskud op til $10,000, og handel med øget kapital.
- Udnyttelse op til 1: 3000: Maksimering af potentielle overskud med en af de højeste gearingsmuligheder, der findes.
- Prisen 'Bedste kundeservicemægler Asia': Anerkendt ekspertise inden for kundesupport og service.
- Sæsonbestemte kampagner: Nyd en række eksklusive bonusser og kampagnetilbud hele året rundt.

>> Tilmeld dig FBS Broker-konto her <
Klik her nedenfor for at downloade: