


En af grundene til, at mange nye handlende har meget svært ved at profitere på valutamarkedet, er fordi de ikke handler i trendens retning. I nogle tilfælde er det et spørgsmål om at have en strategi, der ikke er egnet til at handle med trenden. Ved mange lejligheder er det på grund af frygten for at tage handelen i slutningen af en trend.
Selvom det er rigtigt, at handlende bør undgå at jagte trenden, indebærer handel i retning af trenden også, at du bliver nødt til at handle midt i trenden i stedet for i begyndelsen af trenden. Selvfølgelig er udbytterne måske ikke så høje, som hvis handlen blev taget i begyndelsen af trenden. Selvfølgelig er der en risiko for, at tendensen snart vender. Handel med trenden kan dog også betyde handel med større sandsynlighed for at vinde.
På den anden side udgør det også store risici at forudse trendvendinger. Selvom det er rigtigt, at handler ville have højere udbytte, fordi handlen tages i begyndelsen af trenden, kan det også være meget vanskeligt at fange trendvendinger, når prisen vender tilbage.
Oracle Move
Oracle Move eller 100 Pips Momentum er en tilpasset trend efter teknisk indikator, som er baseret på et kortsigtet glidende gennemsnit.
De fleste glidende gennemsnitslinjer har en tendens til at have to svagheder. For det første har de fleste glidende gennemsnitslinjer en tendens til at være haltende sammenlignet med prishandling. Forsinkede indikatorsignaler får ofte handlende til at gå ind i et godt handelssetup og forlade en vindende handel lidt for sent. Dette reducerer ofte drastisk den potentielle fortjeneste, som den erhvervsdrivende kunne have tjent eller endnu værre, forvandle en potentielt vindende handel til et tab. Den anden svaghed er, at mange glidende gennemsnit har en tendens til at være modtagelige for falske signaler, der opstår under piskesave og hakkende markedsforhold. Dette får handlende til at gå ind i en handel, som de ikke burde have handlet i første omgang.
Oracle Move er en indikator, der plotter to kortsigtede glidende gennemsnitslinjer, som drastisk minimerer begge svagheder. Linjerne, som denne indikator plotter, er meget lydhøre over for prisbevægelser, hvilket gør den velegnet til kortsigtede momentumskift, og er samtidig meget glatte, hvilket gør den bedre til at håndtere ujævne markedsforhold.
Den hurtigere glidende gennemsnitslinje er plottet som en blå linje, mens den langsommere glidende gennemsnitslinje er plottet som en rød linje. Trendretningen identificeres derefter baseret på, hvordan de to glidende gennemsnitslinjer overlapper hinanden. Tendensen er bullish, hvis den blå linje er over den røde linje og bearish, hvis den blå linje er under den røde linje. Krydsninger mellem de to linjer kan også være tegn på en potentiel trendvending.
Relative Strength Index
Relative Strength Index (RSI) er en klassisk oscillator type teknisk indikator, som har en række anvendelser. Det kan bruges til at identificere trend, momentum og overkøbte eller oversolgte prisforhold.
RSI er en oscillator, der plotter en linje, der svinger mellem intervallet 0 til 100. Denne linje er beregnet ud fra slutkursen for en nylig handelsperiode sammenlignet med dens historiske kursbevægelser. Den resulterende linje er en linje, der i nogen grad efterligner prisbevægelsens bevægelser baseret på dens svingpunkter.
RSI har markører på 30 og 70. Disse markører indikerer overkøbte eller oversolgte prisforhold. En RSI-linje over 70 indikerer et overkøbt marked, mens en RSI-linje under 30 indikerer en oversolgt tilstand. Omvendt identificerer momentumhandlere stærke brud ud over disse niveauer som en indikation af et stærkt momentum, der kan føre til en trend.
Nogle handlende tilføjer markører på niveau 45, 50 og 55. Niveau 50 markerer trendbias. En RSI-linje, der generelt holder sig over 50 og finder støtte ved 45, er tegn på en bullish tendens. På den anden side er en RSI-linje, der generelt holder sig under 50 og finder modstand ved 55, et tegn på en bearish trend.
Trading Strategi
Oracle Move Trend Following Forex Trading Strategy er en trendfølgende strategi, som finder overensstemmelser mellem den langsigtede trend og den kortsigtede trend ved hjælp af Oracle Move-indikatoren, 100-perioders eksponentielt bevægende gennemsnit (EMA) og RSI.
Den langsigtede trend identificeres ud fra hældningen af 100 EMA-linjen, placeringen af prishandling i forhold til 100 EMA-linjen, samt trendretningen for prishandling.
RSI-linjen bekræfter derefter tendensen baseret på, hvor den generelt er placeret i forhold til 50-markøren, og om den finder støtte på niveau 45 eller modstand på niveau 55.
Prisen ville generelt vende tilbage til sin median. Dette skulle få Oracle Move-linjen til midlertidigt at vende og RSI-linjen til midlertidigt at gå tilbage til området nær 50, mens den stadig finder støtte eller modstand på niveau 45 eller 55.
Da prisen genoptager sin trend, vil Oracle Move-linjen krydse, og RSI-linjen vil bryde over 55 eller falde til under 45, hvilket anklager genoptagelsen af trenden. Dette sammenløb ville være vores handelsopsætning.
Indikatorer:
- 100 pips momentum
- 100 EMA
- Relative Strength Index
Foretrukne tidsrammer: 30-minutters og 1-times diagrammer
Valuta Par: FX majors, mindreårige og krydsninger
Handelssessioner: Tokyo, London og New York sessioner
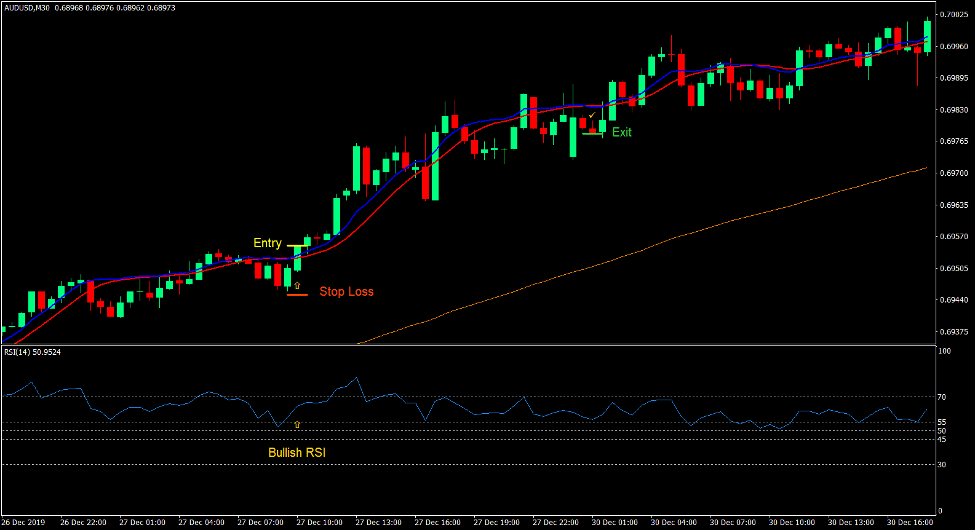
Køb Trade Setup
Indgang
- Prishandling bør være over 100 EMA-linjen.
- Prishandlinger bør være stigende baseret på prisudsving.
- 100 EMA-linjen skulle hælde opad.
- RSI-linjen skal generelt være over 50.
- Prisen skulle gå tilbage, hvilket får den blå Oracle Move-linje til midlertidigt at krydse under den røde linje og RSI-linjen til at gå tilbage mod 50, mens den finder støtte ved 45.
- Den blå Oracle Move-linje skal krydse over den røde linje.
- RSI-linjen bør bryde over 55.
- Indtast en købsordre på bekræftelsen af disse betingelser.
Stop Loss
- Indstil stop losset ved støtten under indgangslyset.
Udgang
- Luk handlen, så snart den blå linje i Oracle Move-indikatoren krydser under den røde linje.

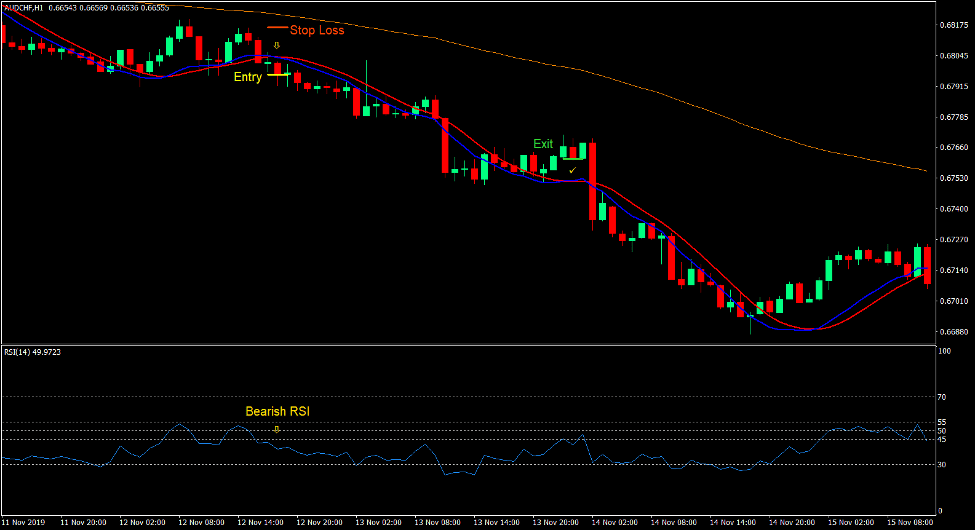
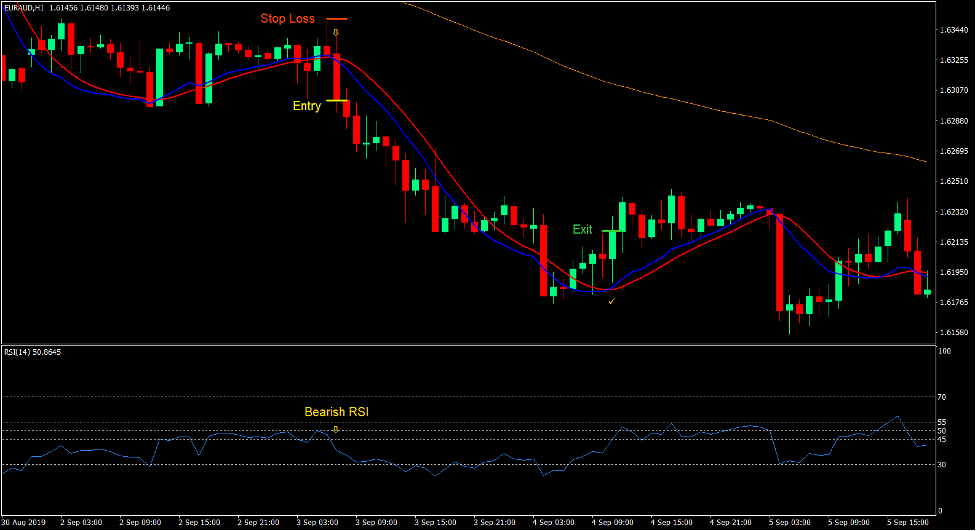
Sælg handelsopsætning
Indgang
- Prishandling bør være under 100 EMA-grænsen.
- Pristiltag bør være på vej ned baseret på prisudsving.
- 100 EMA-linjen skal hælde nedad.
- RSI-linjen skal generelt være under 50.
- Prisen bør gå tilbage, hvilket får den blå Oracle Move-linje til midlertidigt at krydse over den røde linje og RSI-linjen til at gå tilbage mod 50, mens den finder modstand ved 55.
- Den blå Oracle Move-linje skal krydse under den røde linje.
- RSI-linjen skal falde til under 45.
- Indtast en salgsordre ved bekræftelsen af disse betingelser.
Stop Loss
- Indstil stoptabet ved modstanden over indgangslyset.
Udgang
- Luk handlen, så snart den blå linje i Oracle Move-indikatoren krydser over den røde linje.
Konklusion
Denne handelsstrategi er en grundlæggende trendfølgende eller genindtrædende trendstrategi, som gør brug af de responsive kortsigtede signaler fra Oracle Move-indikatoren.
Oracle Move-indikatoren i sig selv er ikke perfekt, men den giver højsandsynlige trendvendingssignaler, som har potentiale til at resultere i en trend.
Kombinationen af 100 EMA-linjen og trendangivelsen af RSI-linjen bekræfter simpelthen retningen af den generelle trend, hvilket igen burde efterlade os med høj sandsynlighedstendens efter handelsopsætninger.
Anbefalede MT4-mæglere
XM Broker
- Gratis $ 50 For at begynde at handle med det samme! (Tilbagetrækbar fortjeneste)
- Indbetalingsbonus op til $5,000
- Ubegrænset loyalitetsprogram
- Prisvindende Forex Broker
- Yderligere eksklusive bonusser Gennem året

>> Tilmeld dig XM Broker-konto her <
FBS mægler
- Handel 100 bonus: Gratis $100 for at kickstarte din handelsrejse!
- 100% indbetalingsbonus: Fordoble dit indskud op til $10,000, og handel med øget kapital.
- Udnyttelse op til 1: 3000: Maksimering af potentielle overskud med en af de højeste gearingsmuligheder, der findes.
- Prisen 'Bedste kundeservicemægler Asia': Anerkendt ekspertise inden for kundesupport og service.
- Sæsonbestemte kampagner: Nyd en række eksklusive bonusser og kampagnetilbud hele året rundt.

>> Tilmeld dig FBS Broker-konto her <
Klik her nedenfor for at downloade: