


Handelssucces er statistisk afhængig af to faktorer, gevinstrater og risiko-belønningsforhold. Handlende, der kunne finde en god blanding af gevinstrater og risiko-belønningsforhold, er dem, der ender med at være konsekvent rentable, når de handler på forexmarkederne.
Gevinstsatserne vedrører gevinstprocenterne for en erhvervsdrivende. Dette vedrører den procentdel af vindende handler, som en erhvervsdrivende opnår ud af et antal handler, uanset gevinstens størrelse. Handlende med høje gevinstrater har en tendens til at vinde oftere, end de ville tabe. Risiko-belønningsforhold på den anden side vedrører dollarbeløbet, som en erhvervsdrivende har tendens til at tjene på en vindende handel sammenlignet med dollarbeløbet, der risikeres på hver handel, eller det gennemsnitlige tab på hver tabende handel.
At have en høj gevinstrate resulterer ikke automatisk i en vindende strategi, ligesom høje risiko-belønningsforhold heller ikke resulterer i en vindende strategi. Handlende bør finde en god blanding mellem de to. Handlende, der kunne handle med gevinstrater over 50 % og risiko-belønningsforhold på mere end 1:1, har en tendens til at være konsekvent rentable.
En af måderne til at forbedre en erhvervsdrivendes nøjagtighed og udbytte er ved at lede efter sammenløb. Confluences giver trendsignaler, der peger i samme retning på nogenlunde samme tidspunkt. Disse betingelser er de bedste for fremragende handelsopsætninger med høje sandsynlige udbytter og høje gevinstsandsynligheder.
Heiken Ashi glattet
Heiken Ashi Smoothed er en trend efter teknisk indikator, som er en udløber af Heiken Ashi lysestagerne.
Heiken Ashi oversætter bogstaveligt talt til gennemsnitlige barer på japansk. Heiken Ashi lysestagerne er netop det. De er lysestager med åbne og lukkede niveauer modificeret for at justere for gennemsnitlige prisbevægelser. Resultatet er prisbjælker, som kun skifter farve, når den kortsigtede trend har ændret sig.
Heiken Ashi Smoothed-indikatoren plotter på den anden side også søjler, der skifter farve for at angive trendretning. Disse søjler bevæger sig dog mere på samme måde som glidende gennemsnit. Røde søjler indikerer en bearish trend, mens lime søjler indikerer en bullish trend.
Heiken Ashi Smoothed-stængerne har en tendens til at være en pålidelig trendvendingsindikator, da den er mindre modtagelig for falske trendvendinger.
Handlende kan bruge ændringen af farven på søjlerne som en indikation på en sandsynlig trendvending.
Relative Strength Index
Relative Strength Index (RSI) er en momentum teknisk indikator, som er en oscillatortype indikator.
Den plotter en RSI-linje, som kunne svinge inden for området fra 0 til 100.
Den har et midtpunkt på 50, som kunne bruges som en indikation af trendbias baseret på placeringen af linjen i forhold til den.
Den har også markører på niveau 30 og 70. Gennemsnitlige reverseringshandlere ser en RSI-linje under 30 som en indikation af et oversolgt marked, mens en RSI-linje over 70 tolkes som en indikation af et overkøbt marked. Momentum-handlere ser stærke brud ud over dette interval som en indikation af et stærkt momentum-udbrud. Begge synspunkter kan være korrekte på et bestemt tidspunkt. Det hele koger ned til karakteristikaene ved prishandling, da RSI-linjen når disse punkter.
Nogle handlende tilføjer også niveau 45 og 55 for at bekræfte tendenser. Niveau 45 fungerer som en støtte under et bullish trendmarkedsmiljø, mens niveau 55 fungerer som en modstand under et bearish trending marked.
Blæksprutte indikator
Octopus-indikatoren er en brugerdefineret teknisk indikator, som kan bruges som et trendretningsfilter.
Denne indikator er af binær karakter. Den plotter kun stænger med samme længde. Farven på søjlerne ændres dog for at angive trendens retning.
Grønne søjler indikerer en bullish trend, mens røde søjler indikerer en bearish trend.
Handlende kan bruge denne indikator til at bortfiltrere handler, der går imod den aktuelle retning af trenden. Det kan også bruges til at bekræfte trendvendende signaler baseret på ændring af farven på søjlerne.
Trading Strategi
Octopus Heiken Ashi Signal Forex Trading Strategy er en simpel trendfølgestrategi, som er baseret på sammenløbet af de tre højsandsynlighedstendensfølgende indikatorer ovenfor.
For det første skal vi tilpasse vores handelsretning med retningen af den langsigtede trend. Vi vil bruge 200-periodens eksponentielle bevægelige gennemsnit (EMA) til at gøre dette. Langsigtet trendretning er baseret på placeringen af prishandling i forhold til 200 EMA-linjen, samt hældningen af 200 EMA-linjen.
Derefter observeres sammenløb mellem de tre indikatorer.
På Heiken Ashi Smoothed-indikatoren og Octopus-indikatoren er signaler baseret på ændring af farven på søjlerne.
På RSI er trendbekræftelse baseret på prisbrud over 55 eller fald under 45.
Indikatorer:
- Heiken_Ashi_Smoothed
- MA-periode: 15
- MA Periode 2: 6
- 200 EMA
- Blæksprutte_1
- Relative Strength Index
- Periode: 19
Foretrukne tidsrammer: 15-minutters, 30-minutters, 1-timers og 4-timers diagrammer
Valuta Par: FX majors, mindreårige og krydsninger
Handelssessioner: Tokyo, London og New York sessioner
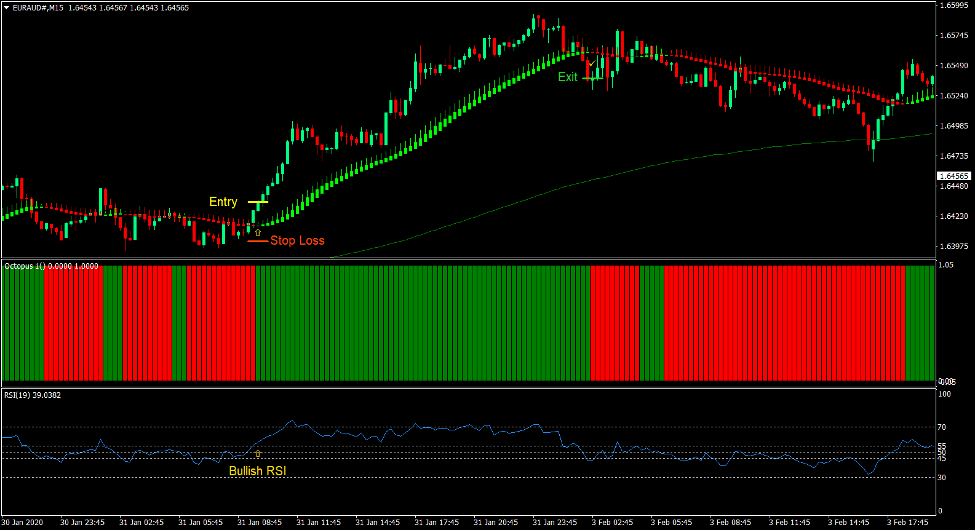
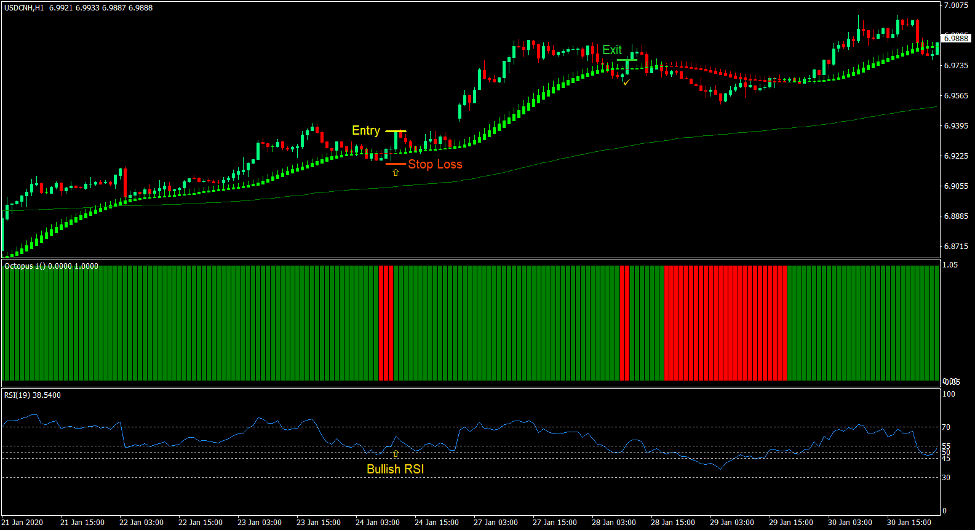
Køb Trade Setup
Indgang
- Prishandling bør være over 200 EMA-linjen.
- Octopus-bjælkerne skal skifte til grønne.
- Heiken Ashi Smoothed-stængerne bør skifte til lime.
- RSI-linjen bør bryde over 55.
- Indtast en købsordre på sammenløbet af disse betingelser.
Stop Loss
- Indstil stop loss på en støtte under indgangslyset.
Udgang
- Luk handelen, så snart Heiken Ashi Smoothed-bjælkerne skifter til røde.
Sælg handelsopsætning
Indgang
- Prishandling bør være under 200 EMA-grænsen.
- Octopus-bjælkerne skal skifte til røde.
- Heiken Ashi Smoothed-bjælkerne skal skifte til røde.
- RSI-linjen skal falde til under 45.
- Indtast en salgsordre på sammenløbet af disse betingelser.
Stop Loss
- Indstil stoptabet på en modstand over indgangslyset.
Udgang
- Luk handelen, så snart Heiken Ashi Smoothed-stængerne skifter til lime.

Konklusion
Heiken Ashi Smoothed-indikatoren er en yderst pålidelig trendfølgeindikator. Handlende kunne stole på de trendvendende signaler, de producerer. Det er dog ikke alle signaler om trendvending, der fungerer fint. Dette er grunden til, at signaler bør afstemmes med en langsigtet tendens for at øge sandsynligheden for en handelsopsætning.
Tilføjelse af sammenløb med RSI og Octopus-indikatoren øger chancerne for en sejr markant. De resulterende handelsopsætninger bør være opsætninger med høj sandsynlighed med et anstændigt potentielt udbytte.
Når den bruges i det korrekte markedsmiljø, som er et langsigtet trendmarked, bør denne strategi gøre underværker.
Anbefalede MT4-mæglere
XM Broker
- Gratis $ 50 For at begynde at handle med det samme! (Tilbagetrækbar fortjeneste)
- Indbetalingsbonus op til $5,000
- Ubegrænset loyalitetsprogram
- Prisvindende Forex Broker
- Yderligere eksklusive bonusser Gennem året

>> Tilmeld dig XM Broker-konto her <
FBS mægler
- Handel 100 bonus: Gratis $100 for at kickstarte din handelsrejse!
- 100% indbetalingsbonus: Fordoble dit indskud op til $10,000, og handel med øget kapital.
- Udnyttelse op til 1: 3000: Maksimering af potentielle overskud med en af de højeste gearingsmuligheder, der findes.
- Prisen 'Bedste kundeservicemægler Asia': Anerkendt ekspertise inden for kundesupport og service.
- Sæsonbestemte kampagner: Nyd en række eksklusive bonusser og kampagnetilbud hele året rundt.

>> Tilmeld dig FBS Broker-konto her <
Klik her nedenfor for at downloade: