


Tekniske handlende bruger ofte en række handelsindikatorer for at implementere deres strategi. Ofte vil handlende bruge indikatorer, der bestemmer trendretning og potentielle trendvendinger. Det er dog ikke alle handelsindikatorer, der er ens. Nogle arbejder, mens andre ikke gør. Nogle er rentable, nogle er ikke. Nogle indikatorer er simpelthen bedre end andre.
Ichimoku Cloud-indikatoren er en af de indikatorer, der har vist sig at være rentable på lang sigt, selv som en selvstændig indikator. Denne strategi gør brug af styrkerne ved Ichimoku Cloud-indikatoren for konsekvent at drage fordel af markedet.
Tenkan-sen og Kijun-sen
Ichimoku Cloud-indikatoren er en af de indikatorer, der har vist sig at være en rentabel selvstændig indikator, selv når den bruges på lang sigt. Dette skyldes sandsynligvis, at det på en eller anden måde giver handlende et mere komplet billede med hensyn til trendretningen.
Tenkan-sen og Kijun-sen er nok det vigtigste par linjer i Ichimoku Cloud-indikatoren. De to indikatorer repræsenterer de kort- og mellemfristede tendenser og er de linjer, der hovedsageligt bruges som indgangssignaler.
Kijun-sen repræsenterer den langsigtede trend af de to og omtales ofte som signallinjen. Tenkan-sen på den anden side repræsenterer den kortsigtede trend og kaldes ofte konverteringslinjen. Handelssignaler genereres baseret på krydsningen af de to indikatorer. Et købssignal genereres, når Tenkan-sen krydser over Kijun-sen, mens et salgssignal genereres, når Tenkan-sen krydser under Kijun-sen-linjen.
BT1 indikator
BT1-indikatoren er en tilpasset trendindikator, der forsøger at forudsige retningen af den kortsigtede trend. Det gør den ved at overlejre en streg på lysestagerne. Disse linjer skifter farve, hver gang den registrerer en trendændring på den kortsigtede trend. For denne skabelon har vi sat linjerne til at blive tegnet blå, når tendensen er bullish og gul, hvis tendensen er bearish.
Denne indikator virker på den kortsigtede tendens og reagerer meget som Gann HiLo og Heiken-Ashi lysestageindikatorerne. Disse typer indikatorer har en tendens til at fungere som gode indgangssignaler for kortsigtede handler og er også gode tidlige advarsler for kortsigtede trendvendinger.
BSTrend-indikator
BSTrend-indikatoren er en brugerdefineret indikator, som hjælper handlende med at identificere trendretning. Det gør den ved at udskrive streger, der skifter farver. Bullish søjler er trykt himmelblå, mens bearish søjler er trykt violet. Denne indikator er binær af natur og udskriver søjler, der er enten +1 eller -1. Denne binære karakteristik af indikatoren gør den til et fremragende trendretningsfilter. Dette giver handlende mulighed for objektivt at bestemme trendretning uden megen forvirring.
Trading Strategi
Denne strategi er en crossover-strategi baseret på Tenkan-sen- og Kijun-sen-linjerne i Ichimoku Cloud-indikatoren. Vi vil dog også bruge BT1- og BSTrend-indikatorerne som komplementære indikatorer, der tjener forskellige formål inden for denne strategi.
BT1-indikatoren ville bestemme den kortsigtede tendens og ville fungere som en bekræftelse af handelssignalet fra Tenkan-sen og Kijun-sen linjeovergangen. Bortset fra dette ville BT1-indikatoren også tjene som en tidlig kortsigtet trendvending, som ville give os mulighed for at forlade handlen tidligere før den faktiske kortsigtede trendvending.
BSTrend-indikatoren ville tjene som det langsigtede trendfilter. Handelssignaler, der ikke er i overensstemmelse med BSTrend-indikatoren, vil ikke blive taget i betragtning, da dette ville betyde, at tendenserne ikke er afstemt. Bortset fra dette ville BSTrend også være et udgangssignal, da der er tilfælde, hvor BSTrend også ville indikere en trendvending forud for krydsningen af Tenkan-sen og Kijun-sen.
Indikatorer:
- Ichimoku Kinko Hyo
- BT1
- Risiko: 3
- BSTrend
- Periode: 12
Tidsramme: 4-timers og daglige diagrammer
Valuta Par: dur og mol par
Handelssession: Tokyo, London og New York sessioner
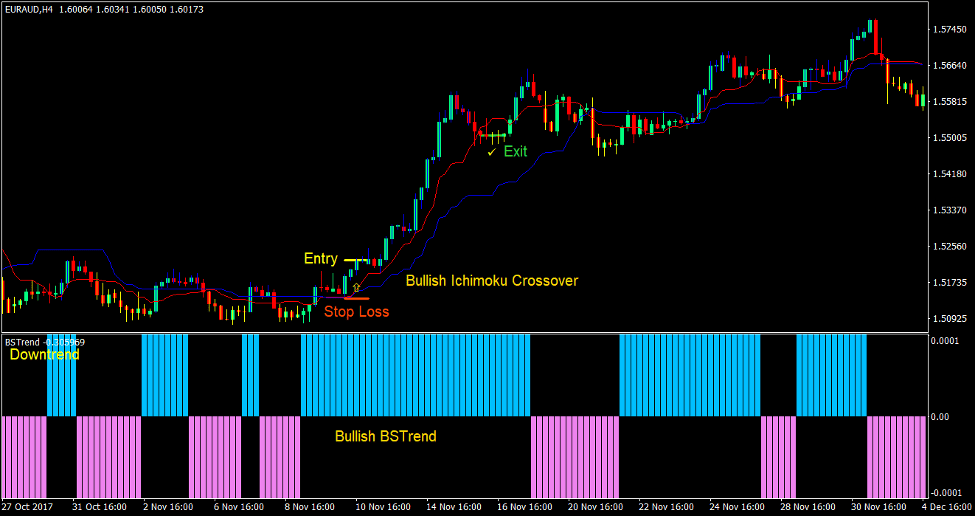
Køb Trade Setup
Indgang:
- BSTrend-indikatoren skal udskrive himmelblå søjler, der indikerer en bullish trend
- BT1-indikatoren skulle udskrive blå linjer på lysestagerne, hvilket indikerer en bullish kortsigtet tendens
- Tenkan-sen-linjen (rød) bør krydse over Kijun-sen-linjen (blå), hvilket indikerer en bullish trendvending
- Indtast en købsordre på sammenløbet af ovenstående betingelser
Stop Loss
- Indstil stop loss på støtteniveauet under indgangslyset
Udgang
- Luk handlen, så snart BT1-indikatoren tegner en gul streg på lysestagerne
- Luk handlen, så snart BSTrend-indikatoren udskriver en violet bjælke
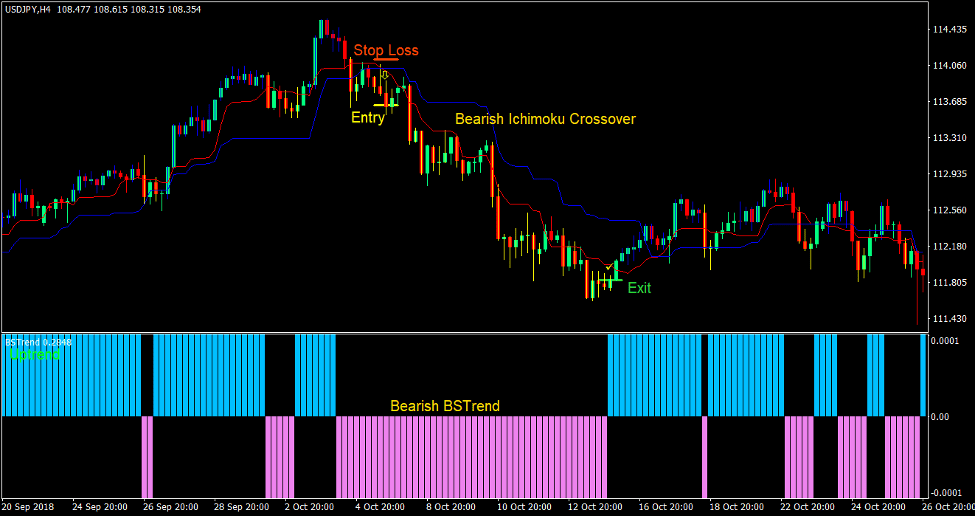
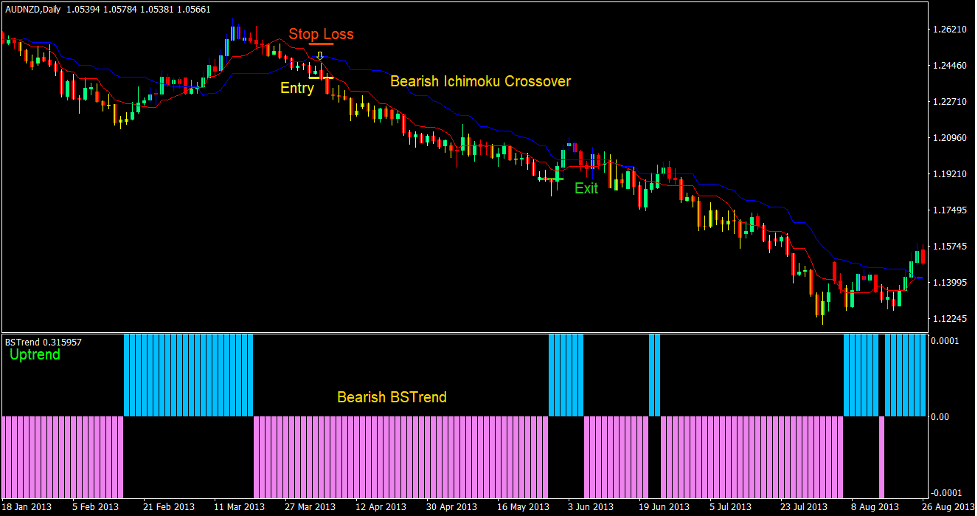
Sælg handelsopsætning
Indgang:
- BSTrend-indikatoren bør udskrive violette søjler, der indikerer en bearish trend
- BT1-indikatoren skulle udskrive gule linjer på lysestagerne, hvilket indikerer en bearish kortsigtet tendens
- Tenkan-sen-linjen (rød) bør krydse under Kijun-sen-linjen (blå), hvilket indikerer en bearish trendvending
- Indtast en salgsordre på sammenløbet af ovenstående betingelser
Stop Loss
- Indstil stoptabet på modstandsniveauet under indgangslyset
Udgang
- Luk handlen, så snart BT1-indikatoren tegner en blå streg på lysestagerne
- Luk handlen, så snart BSTrend-indikatoren udskriver en himmelblå bjælke
Konklusion
Ichimoku Cross Forex Trading Strategy er en crossover-strategi med høj sandsynlighed. Brug af Ichimoku Cloud-indikatoren alene er allerede en rentabel handelsstrategi. Inkludering af BT1 og BSTrend brugerdefinerede indikatorer som en bekræftelse øger sandsynligheden for en vindende handel på grund af justeringen af de kortsigtede og langsigtede tendenser.
Denne strategi giver mulighed for en relativt højere gevinstrate, mens den samtidig tillader vindende handler at køre længere, hvilket kan resultere i handler med højt afkast. Handel med denne strategi med et sundt pengestyringssystem vil give handlende mulighed for konsekvent at drage fordel af markedet på lang sigt.
Anbefalede MT4-mæglere
XM Broker
- Gratis $ 50 For at begynde at handle med det samme! (Tilbagetrækbar fortjeneste)
- Indbetalingsbonus op til $5,000
- Ubegrænset loyalitetsprogram
- Prisvindende Forex Broker
- Yderligere eksklusive bonusser Gennem året

>> Tilmeld dig XM Broker-konto her <
FBS mægler
- Handel 100 bonus: Gratis $100 for at kickstarte din handelsrejse!
- 100% indbetalingsbonus: Fordoble dit indskud op til $10,000, og handel med øget kapital.
- Udnyttelse op til 1: 3000: Maksimering af potentielle overskud med en af de højeste gearingsmuligheder, der findes.
- Prisen 'Bedste kundeservicemægler Asia': Anerkendt ekspertise inden for kundesupport og service.
- Sæsonbestemte kampagner: Nyd en række eksklusive bonusser og kampagnetilbud hele året rundt.

>> Tilmeld dig FBS Broker-konto her <
Klik her nedenfor for at downloade: